
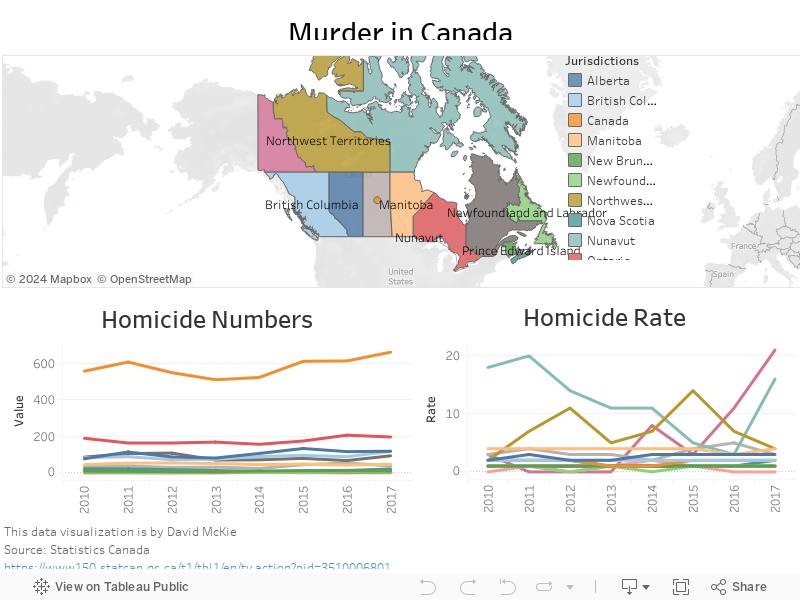
Clicking on the double arrow to the left of the map produces two tabs: one for details, the other for the legend.
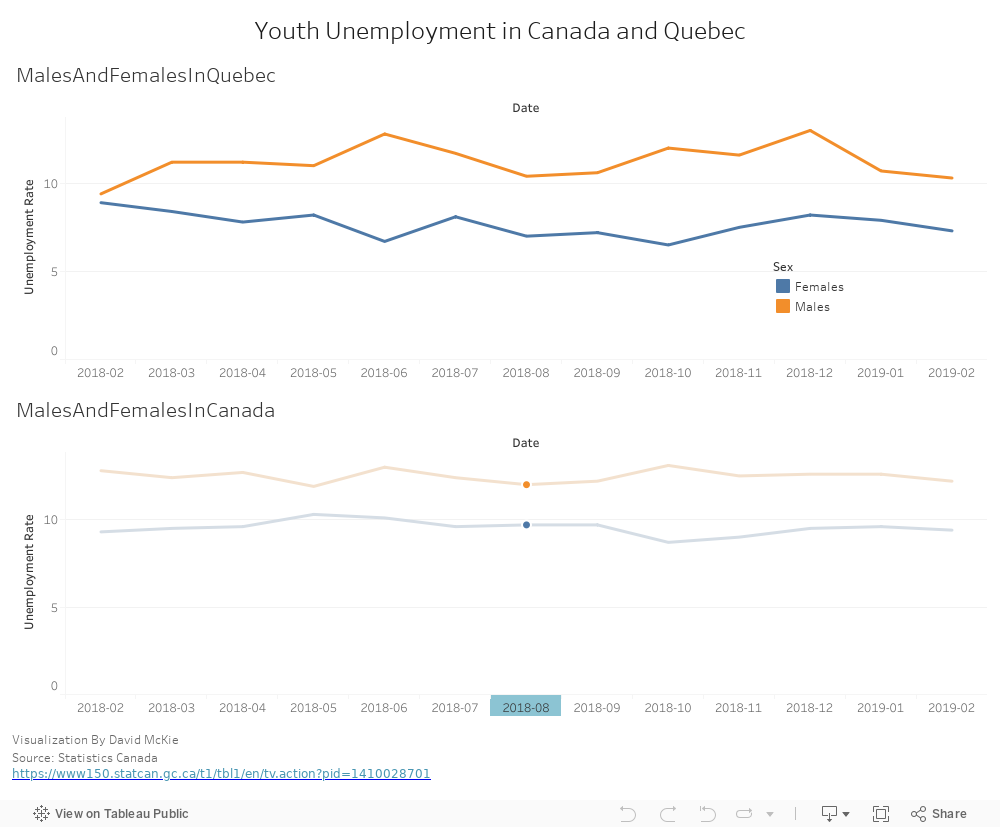
Source: Statistics Canada
Clicking on the double arrow to the left of the map produces two tabs: one for details, the other for the legend.
Source: Statistics Canada


Source: Statistics Canada
Unfounded (The Globe and Mail)
https://www.theglobeandmail.com/news/investigations/unfounded-sexual-assault-canada-main/article33891309/
Easy Money: How Fraudsters can make millions off Canadian investors, get barely punished and do it again (The Globe and Mail)
https://www.theglobeandmail.com/news/investigations/easy-money-canadian-securities-fraud/article37350705/
Ottawa nursing homes have seen at least 163 cases of abuse since 2012 (Ottawa-Citizen)
http://ottawacitizen.com/news/local-news/more-than-2000-cases-of-non-compliance-and-163-cases-of-abuse-at-ottawa-long-term-care-homes
Big corporate donors give big to the B.C. Liberals (Vancouver Sun)
http://vancouversun.com/business/local-business/big-corporate-donors-give-big-to-the-b-c-liberals
In search of Canada’s elusive shadow population (Discourse Media)
https://www.thediscourse.ca/data/canadas-shadow-population
Dangerous Doses (Chicago Tribune)
http://www.chicagotribune.com/news/watchdog/druginteractions/
Too Broke for Bankruptcy
https://www.propublica.org/series/too-broke-for-bankruptcy
No Place for Foreigners: Why Hanna is invited to view an apartment and Ismail is not
https://www.hanna-und-ismail.de/english/index.html
Who backs Canada’s Politicians (National Post)
http://special.nationalpost.com/follow-the-money/database
Is anything left of Mosul? (BBC News)
http://www.bbc.co.uk/news/resources/idt-9d41ef6c-97c9-4953-ba43-284cc62ffdd0
In 466 days, President Trump has made 3,001 false or misleading claims (The Washington Post)
https://www.washingtonpost.com/graphics/politics/trump-claims-database/?utm_term=.204623ba5205
The Halifax Explosion killed nearly 2,000 people. (Global News & Kings Journalism)
https://globalnews.ca/news/3870656/interactive-map-halifax-explosion/
https://ukings.ca/news/journalism-students-create-multi-media-retelling-of-the-halifax-explosion/
The Ryerson School of Journalism, in partnership with The Toronto Star
https://www.thestar.com/news/investigations/2018/02/16/how-a-broken-jury-list-makes-ontario-justice-whiter-richer-and-less-like-your-community.html
Census 2016: Toronto housing affordability now worse than Vancouver
https://beta.theglobeandmail.com/report-on-business/census-2016-residents-in-toronto-area-struggle-the-most-with-home-affordability/article36717906/?ref=http://www.theglobeandmail.com&
William Wolfe-Wylie and Dave Seglins (CBC Toronto)
http://www.cbc.ca/news/business/tickets-scalping-blue-jays-1.4597286
Nael Shiab (L’Actualité)
http://lactualite.com/societe/2018/01/23/philippe-couillard-vous-fait-il-perdre-ou-economiser-de-largent-notre-robot-journaliste-repond-a-vos-questions/
Rachel Browne (Vice News)
https://news.vice.com/en_ca/article/d35eyq/black-and-indigenous-people-are-overrepresented-in-canadas-weed-arrests
Jacques Marcoux and Katie Nicholson (CBC Manitoba)
https://newsinteractives.cbc.ca/longform-custom/deadly-force
Nael Shiab (L’Actualité)
http://lactualite.com/societe/2017/06/28/un-canada-sans-immigrants/
Terra Ciolfe and Nick Taylor-Vaisey (Maclean’s)
http://www.macleans.ca/wooing-america/
Canada’s Highest Paid CEO’s (The Globe and Mail)
https://www.theglobeandmail.com/report-on-business/careers/management/executive-compensation/table-canadas-top-100-highest-paid-ceos/article30131636/?from=30171589
Where the Immigrants in Canada Live
http://www.cbc.ca/news/politics/map-where-immigrants-in-canada-live-1.4372261
Change in Median Rent, 2011-16 : Median Monthly Rent, 2016 https://taracarman.carto.com/builder/aa80fe48-d85f-4b5d-9d50-ecd8169384fc/embed?state=%7B%22map%22%3A%7B%22ne%22%3A%5B43.06710416548514%2C-96.84081785380842%5D%2C%22sw%22%3A%5B52.45452160147335%2C-65.22216551005842%5D%2C%22center%22%3A%5B47.97357964331227%2C-81.03149168193342%5D%2C%22zoom%22%3A6%7D%7D
Below is a map of blacks in Ottawa and Gatineau, based on the 2016 census. The dark colours represent neighbourhoods that experienced the fastest growth between 2011 and 2016.
Source: Statistics Canada