All posts by Ruth Tecle

Federal funding for water advisory crisis is questionable

Share


  • The topic: Funding to eliminate water advisories on First Nation reserves.
  • What’s new: The provincial break-down of funds.
  • Why it’s important: The funding strategy’s effect hints that there might be an imbalance in the province’s allocation of funds that may mean missing the five-year target.
  • What the government says: The government stands by the funds the allocated last year. The minister of health said in a statement earlier this year that there’s still a lot of work to do.
  • What others say: Emily Lui says the way the government is distinguishing long-term advisories from short-term advisories being overlooked while the Canadian Centre for Policy Alternatives says the government should be spending more money on this issue.
  • What’s next: The government is sticking to their planned targets.

Manitoba’s provincial government has been allocated an estimated $356.4 million over five years as part of a federal strategy to end long-term drinking water advisories on First Nations reserves.

Approximately 19.8 per cent of the federal government’s 2016 pledge of $1.8 billion has been allocated to address the water supply issues. According to an access to information request, the percentage of funding allotted to Manitoba reflects the share of Canada’s Indigenous population that lives in the province.

In the year since the announcement, several communities are still plagued with long-term advisories. According to the Indigenous and Northern Affairs Canada’s own website, 71 of the 76 long-term advisories across Canada are still in place despite the plan to lift all drinking water advisories by 2021.

In Manitoba, only one of two long-term drinking water advisories is slated for funding so far. The advisory for this project affecting the Pauingassi First Nation has yet to be removed despite the province having significantly less advisories to address compared to other provinces.

Little can be determined on the impact of the government’s 2016 investment based on the way the government is publically tracking improvement. For example, neighbouring provinces Ontario and Saskatchewan had 62 long-term advisories between them during the funding announcement. However, the government site provided by a spokeswoman from Indigenous and Northern Affairs Canada indicates that nine have been removed since 2015—disguising that only five long-term advisories across the country that have been removed.

The designation of long-term and short-term advisories as determined by the government is a topic of concern for Emily Lui, a spokeswoman for the Council of Canadians who says she uses her position to raise awareness on water issues in First Nation communities.

She shared what she believes is an overlooked aspect of the government’s approach to the investments in an email exchange which read: “A review of the long-term advisories (in place for one year or more) versus the short-term advisories (in place for less than a year) raises questions about whether the dates set for the DWAs show the full picture.”

Last March, the government released a statement addressing its continued commitment to the five-year plan to remove all long-term advisories despite achieving less than ten per cent in the first year. The written statement quotes the Minister of Indigenous and Northern Affairs, Carolyn Bennett, as saying “Many First Nation families are just now able to drink their water and we have a solid, achievable plan to end the remaining long-term drinking water advisories affecting INAC-funded public systems on-reserve within our promised five-year timeframe.”

Meanwhile, the Minister of Health, Jane Philpott, said: “while there is still much work to be done, I am pleased to see progress is being made to lift long-term drinking water advisories.”

On the same day the statement was released, the national think tank “Canadian Centre for Policy Alternatives released a report which included a reimagined federal budget called The Alternative Federal Budget 2017: High Stakes, Clear Choices. They assigned $1.9 billion per year over the next three years to deal with the water advisories nation-wide—more than three times the current funding.

The federal spokeswomen weren’t available to address any specific questions regarding the situation in Manitoba, the federal funding strategy, or the rationale behind allocating funds to provinces based on the percentage of their Indigenous population as opposed to the condition of their facilities or the number of communities affected.

Helpful documents:

ATIP requests:

Dramatic increases in Toronto elementary school teachers making over $100 000

Share

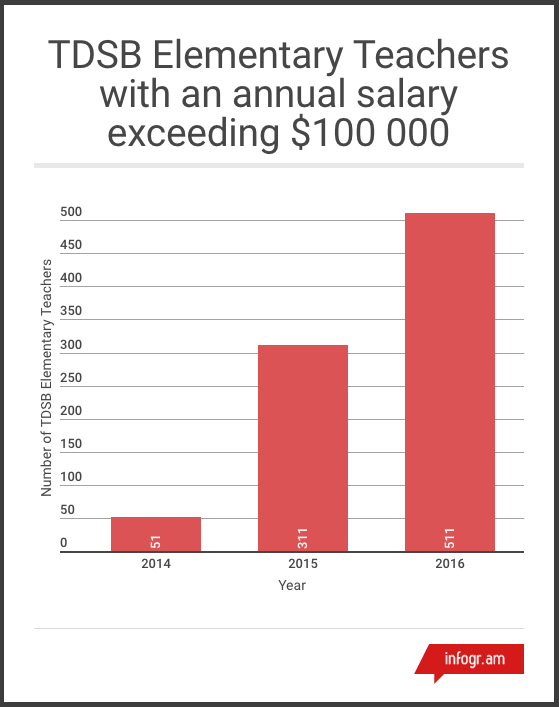
The number of Toronto District School Board teachers with the highest seniority is increasing and so are their bank accounts. Since 2014, seniority has been tied to a 902 per cent increase in elementary teachers who’ve earned an annual salary of over $100 000, according to an analysis of data provided by the provincial government.

The salary data document is informally known as the “sunshine list” is released annually under the Public Sector Salary Disclosure Act. It lists the salary of public sector employees who earn over $100, 000. In the province’s April 2014 disclosure, 51 Toronto elementary school teachers employed by the public school board made the list. The number jumped to 511 teachers by 2016. Spikes in salaries occurred in elementary school boards across the province but Toronto is home to the largest.

The number of teachers making over $100 000 has been growing exponentially since 2014.

These spikes are despite a collective agreement salary grid which, in 2014, reached $94 707 a year for the highest certified teacher after ten years. It may seem curious that so many teachers have found a way to earn more than union contracts bargained for but a number of factors can tip a teacher’s income above the grid.

This salary grid was in effect during the dramatic increases in teachers making over 100 000 between 2014-2016.

Ben Eisen, Director of Fraser Institute’s Provincial Prosperity Studies, said the disparity between the salary grid and what teachers took home in recent years is due to “a combination of taking on additional roles like teaching summer school courses or a becoming a department head coupled with the payout for sick days.”

Many senior level teachers have a Retirement Gratuity account filled with unused sick days. When the practice of collecting unused sick days ended in 2012, several accounts amounted to tens of thousands of dollars but in order to obtain the full value teachers must retire.

Teachers can only collect the credit gratuity they accumulated up until August 31, 2012.

Teachers not quite ready to retire can still cash in at a cost of 7.5 per cent for every year short of retirement. When teacher’s contracts expired in August 2014, frantic withdrawals were made to ensure the new provincial majority government didn’t affect their Retirement Gratuity Account.

Ken Lister, Vice Chair of the Financial Budget Committee says the board struggles to bridge the gap between provincial funding and the cost of teachers since their salaries make up two-thirds of their budget. “It’s a historical one,” he says of the funding gap.

The school board’s report, “Financial Facts: Revenue and Expenditure Trends” details the funding gap. “Part of the gap is because we have ‘experienced teachers with seniority’ and labour issues,” said Lister. Lister is not convinced retirement gratuity explains much of the gap. He wants to see the province upload the cost of teacher benefits. “It effects the amount we can spend repairing schools,” he said.

Comparatively, Eisen is concerned what effect compensation is having on the province’s finances and its ability to sustain increasing expenses.

“It’s important to look at in context of the challenges the province is facing, how it fits into the broader fiscal level and high debt level when looking at what’s taking place with respect to compensation,” said Eisen.

There are arguments the disclosure benchmark does not reflect inflation since the act was passed in 1996. According to the Bank of Canada’s inflation calculator, the benchmark would move to $142,857.14.

According to Eisen, it depends on how the information is used as an accountability measure of the province. “It’s important that additional spending is producing additional results and what’s missing is accountability mechanisms,” said Eisen.

Last February, the teacher’s union was able to secure a two-year extension on the terms of their existing collective bargaining agreement—which includes an annual increase by 1.5 per cent.

The number of teachers with 10 or more years of experience made up 64 per cent of the workforce in 2014-15. This is amount of teachers making the maximum amount on the collective agreement salary grid.

25 years of NAFTA

Share

This year marks the 25th anniversary of when Canada, Mexico and the United States gathered to sign the North American Free Trade Agreement (NAFTA)—a policy that allowed the three countries to increase the movement of imports and exports between their borders by limiting tariffs.

In the fall of 1992, the leaders of the signatory nations addressed the press as they stood side-by-side each behind their own podium. The outdoor ceremony took place in San Antonio, Texas. It marked the symbolic agreement between the nations before their respective governments would go on to pass formal legislation enacting the largest free trade agreement at the time.

Before NAFTA, the nation’s free trade agreement with the U.S. had only been in place since 1989. Canada was experiencing tough economic times under this policy so the public was weary of expanding the trade agreement to include Mexico.

Former Prime Minister Brian Mulroney can be found in archival CBC footage saying, “…everyone said you can’t sell free trade to the Canadian people. No? You just watch and see.” His defensive attitude reflects the mounting disapproval his leadership was facing.

http://www.cbc.ca/player/play/812408899915/
NAFTA deal reached in 1992, CBC Archival Footage

The Canadian think tank, Centre for International Governance Innovation analyzed the last couple decades of NAFTA in a report written by Hugo Perezcano, a legal expert in international trade and negotiations. He says each country’s goal was to generate economic growth by increasing the flow of trade and investment. Meanwhile, Canada’s specific goal was to improve its pre-existing trade deal with the U.S. by gaining direct access to the Mexican market.

Experts like Perezcano say there’s no doubt Canada achieved its goal of increasing trade and investment flows. According to the 2015 report, imports into Mexico increased almost 407 per cent, going from $78.2 billion to $396.5 billion.

Mulroney credits the two trade agreements ushered in by his government for “much of the prosperity and many of the jobs Canada has enjoyed over the last 25 years.” In a video posted last February from FarmTech, an annual farming conference held in Edmonton, the former Conservative Party leader continued by saying, “it’s been the foundational policy of Canada’s economy and it has reoriented the economy internationally.”


Mulroney being interviewed at FarmTech, February 2017

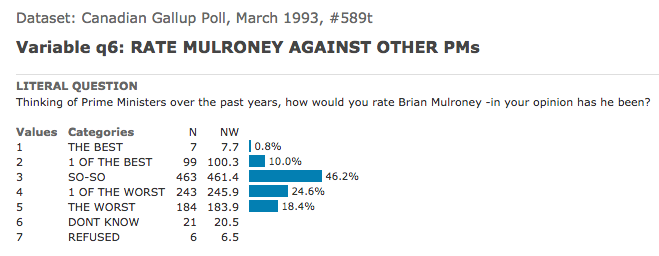
His present-day sentiments can amount to a political “I told you so.” During his time as leader he was unable to gain public after the massive failure of the Charlottetown accord in the summer of 1992. A few months after the San Antonio ceremony that fall, a Gallup poll revealed that a combined 43 per cent of Canadians felt he was either the worst or one of the worst prime ministers. Eventually, he’d step down as leader before the next election took place.

Although NAFTA has seen success, the government lists “increased border security and delays at the border as one of the most challenging aspects of Canadian trade policy” in a preliminary trade and economic analysis report. The challenges of border security are echoed in Perezcano’s report.

The current issue facing NAFTA members is how they will move beyond their 1994 deal to accommodate their modern challenges. While Perezcano’s report details the extensive gains each country has made it also points out the 25-year-old agreement is due for an update.

U.S. president Donald Trump has raised eyebrows and speculation by his advocacy of NAFTA renegotiations. It’s unclear what terms he is trying to change. However, considering his hostility with the Mexican president it’s unlikely that all three leaders will be found standing side-by-side at a podium in celebration anytime soon.

Documentation Notes:

https://www.cigionline.org/sites/default/files/cigi_paper_68_0.pdf
-This is the report on NAFTA by the Centre for International Governance Innovation. I found it on the organization’s website. It’s where I drew the information for most of my expert analysis and stats.

http://www.international.gc.ca/economist-economiste/analysis-analyse/research-recherche/10_pre.aspx?lang=eng

-This is a report by the government of Canada. I found it through as an archived site through a google search. It provided information on how tightening U.S. border security was negatively effecting the Canadian economy.

http://www.cbc.ca/archives/entry/nafta-deal-reached-in-1992

-This archival CBC news coverage of NAFTA from 1992 helped form an understanding of how Canadians viewed NAFTA at the time. It also provided the context for Mulroney’s defensiveness on gaining public support. I found it on the web through a google video search of NAFTA 1992.

https://www.c-span.org/video/?c4543970/nafta
-This video of the ceremony celebrating the NAFTA agreement provided the context for the anniversary portion of the article. I found it on the web through a google video search of NAFTA 1992.

https://www.youtube.com/watch?v=6DmEMlPbDSQ

-This current CBC current affairs coverage helped provide a Canadian perspective on Trump’s comments regarding NAFTA. I found it on YouTube through a search on NAFTA.

FarmTech-Canada’s premier crop production and farm management conference. Jan 31-Feb 2 in Edmonton, Alberta:
https://www.youtube.com/watch?v=eJg9bFY9ikQ  –

-This video helped me get this clip on Mulroney’s current perspective on NAFTA. It’s from a farming conference that took place earlier this year I found it on the web through a YouTube search of Mulroney 2017.
“Free trade agreements have been responsible for much of prosperity and many of the jobs Canada has enjoyed over the last 25 years. It’s been the foundational policy of Canada’s economy and it has reoriented the economy internationally.”- Brian Mulroney

Nevsun Resouces Ltd. abandons production of copper concentrate

Share

In the second quarter of 2016 (Q2) Canadian mining company, Nevsun Resources Ltd (Nevsun), abandoned the production of copper concentrate. This created Q3 copper production numbers that were lower than its projected quarterly goal.

Nevsun is engaged in mining mineral resources. Its main asset is Bisha Mine, located in Eritrea. The North-East African country borders the Red Sea which makes it a strategic location in that region for the flow of exports to markets in Asia and Europe. Bisha Mine specializes in mining gold, copper and zinc resources. The mine began commercial production of gold in 2011.

Red Sea Exports

As planned, Nevsun moved from its gold production phase to copper production phase in 2013. However, the third quarter Management Discussion and Analysis shows the company transitioned from the commercial production of copper to zinc earlier than expected. Transitioning generally occurs when the extracted mineral resource no longer produces a commercially saleable concentrate. In this case, commercial copper production ceased once saleable copper concentrates depleted.

Nevsun’s 2016 objective was to produce 40 to 60 million pounds of copper from primary ore. However, the company’s Progress Update declared it would be unable to meet copper production goals for the second half of the year. In Q3 the company faced a 33 per cent decline in revenue compared to its nine month ended September 2015 numbers and a 67 per cent decline in revenue compared to its three month ended September 2015 numbers. This can be traced back to the depreciation and depletion numbers which increased by 93 per cent as compared to three months ended in September 2015 and 34 per cent as compared to nine months ended in September 2015.


So, how did Nevsun miss its copper target? Working with mineral resources is a calculated risk. In the mining industry, there is a distinction between “mineral reserves” and “mineral resources.” While a mineral reserve illustrates known amounts of concentrated minerals ready for extraction, the term “mineral resources” merely suggests there’s a strong potential for the extraction of mineral concentrates. Though mineral resources offer a strong incentive to extract concentrates, there’s an implication that it may not be possible. Therefore, the challenges faced by Nevsun’s commercial copper production were part of a known risk factored into the mineral resource trade.

Since this challenge is an anticipated risk of the mineral resource industry, Nevsun was able to adapt to its circumstance. In lieu of the ability to export a commercially saleable copper concentrates in Q2 the company found itself speeding up the process to access zinc concentrates. Despite the challenges, the company saw a 33 per cent increase in total assets. This is due to its acquisition of a new mining project in Serbia.

Nevsun also boasts an operating income of $17.5 million in Q3 2016, a 207% increase from operating income of $5.7 million generated in Q3 2015. The Company recorded operating expenses of $2.4 million in Q3 2016 compared $50.1 million to during the same quarter last year. A 54 per cent decrease in described by Nevsun as it being related to the more expensive “pre-commercial production” phase of the mining process took place in the previous quarters.


While operational expenses went down, administrative expenses went way up. Administrative expenses rose by 304 per cent compared to the same time last year. The company explained that this is due to an increase in valuation of the company’s shares. Administrative expenses were made up of increases to employee salaries, benefits and long-term incentive compensation.

Nevsun may have faced challenges in its production of copper concentrates but the company’s expansion into mines in Serbia shows signs of continuing to do business by sticking to the minerals it knows best.

Nevsun Resources Ltd. Stock Prices by rtecle on TradingView.com