All posts by Erika Stark

Erika Stark Assignment 4

Share

Downloading the government:

How Canada’s open data stacks up worldwide

By Erika Stark

The Canadian government’s open data initiatives rank among the top 10 countries worldwide, according to a recent report. But data experts and observers say that while the quantity of data made available by the federal government might look impressive, it still lacks a real impact on government accountability and transparency.

Open data: The practice that makes data freely available by way of portals, metadata, and search tools for reuse by governments, citizens, voluntary organizations, academia, and the private sector in new and unanticipated ways.

– source, data.gc.ca

Canada’s federal open data
The federal government relaunched its open data portal in June. Twenty-five government departments and agencies so far have datasets that are openly available through the portal. Of the 197,825 datasets available as of Oct. 31, 96 per cent are from Natural Resources Canada. The next highest number of datasets for a single department was the 5,396 from Statistics Canada. Thirteen departments, including Elections Canada, the Canada Revenue agency and Public Safety Canada, had less than 10 datasets each.

“The open data portal is a starting place,” said Jeff Sallot, a journalism instructor at Carleton University.

But Sallot said the portal still leaves a lot to be desired.

“I don’t want to dismiss it as window-dressing,” he continued. “I think that there’s a potential there and I applaud the government’s recognition of the importance of new, online ways for citizens for access government information.”

Tracey Lauriault, a postdoctoral researcher at the National Institute for Regional and Spatial Analysis in Maynooth, Ireland, said Canada can “do better.”

Tracey Lauriault (photo provided)

“Canada, overall, is doing very well on the open data front,” she said. “We’re a rich country, we’re very evolved with respect to information technology and we can do much better.”

Top ten in the world

The Open Data Barometer, a global report organized by the Open Data Institute and the Web Foundation, ranked and compared 77 countries, with Canada ranking eighth overall. (The U.K. and U.S. ranked first and second, respectively).

The report broke down the rankings into three main subcategories – readiness, implementation and impact. Canada scored 79 for on a 100-point scale for open data readiness, meaning the country’s “capacity to secure and sustain the full benefits of open data.”

For implementation, which focused on the kind of data available as well as how accessible it was, Canada scored 69. Lastly, the country received just 52 points for the potential impact its open government data could have on a range of things including accountability, entrepreneurial use and government efficiency.

In the report, Canada scored well for openness and availability of data relating to government spending, public transport timetables, election results and map data. Conversely, it ranked poorly on land ownership, government budget and legislation.

Open data, not open government

More access to open data doesn’t translate into a more open government in Canada, said Lauriault. She said the muzzling of government scientists, the cancellation of a long-form census, and the lack of a research data archive demonstrate the government’s lack of openness.

“The federal government has released a portal, but it is not an open government,” she said.

Sallot agreed, also pointing to the country’s outdated access to information legislation. “On politically sensitive pieces of information, the government is not forthcoming,” he said.

While it’s not a catch-all solution, Sallot said increased access to open data can improve openness and accountability within individual government departments.

“The default position of every agency that is funded in any way by government has to be for openness,” he says. “Digital data is so easy to put out there. There were some actual physical limitations on the whole process 30 years ago. That doesn’t exist anymore.”

“If you’re a government agency and you cannot locate your data, you’ve got a real problem.”

Cities leading the way in open data

While the federal government might be lagging behind many of its counterparts in its open data initiatives, Lauriault pointed to Canadian cities as the “champions” of open data. Approximately 37 cities, towns and municipalities across the country have some sort of open data portal.

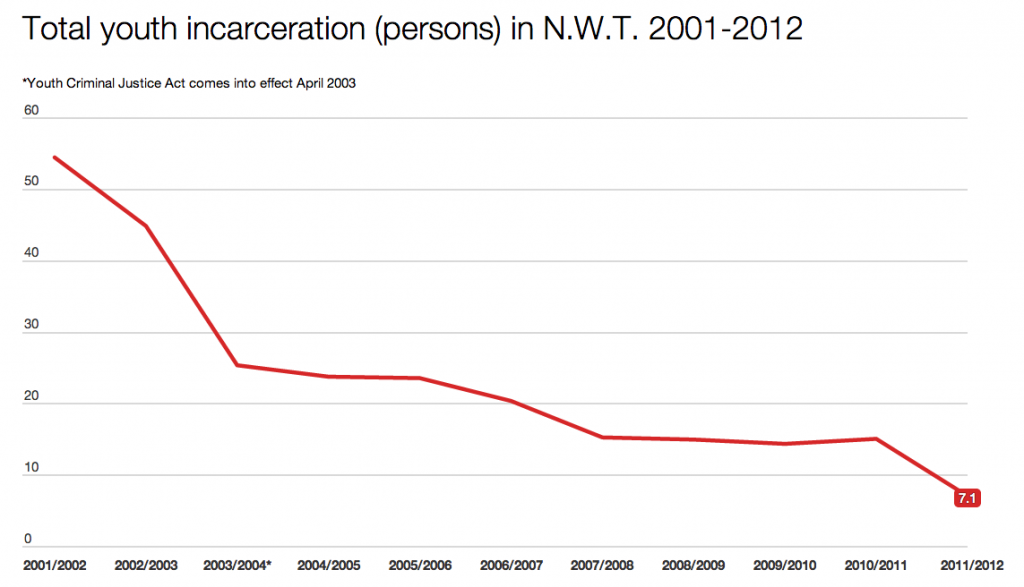
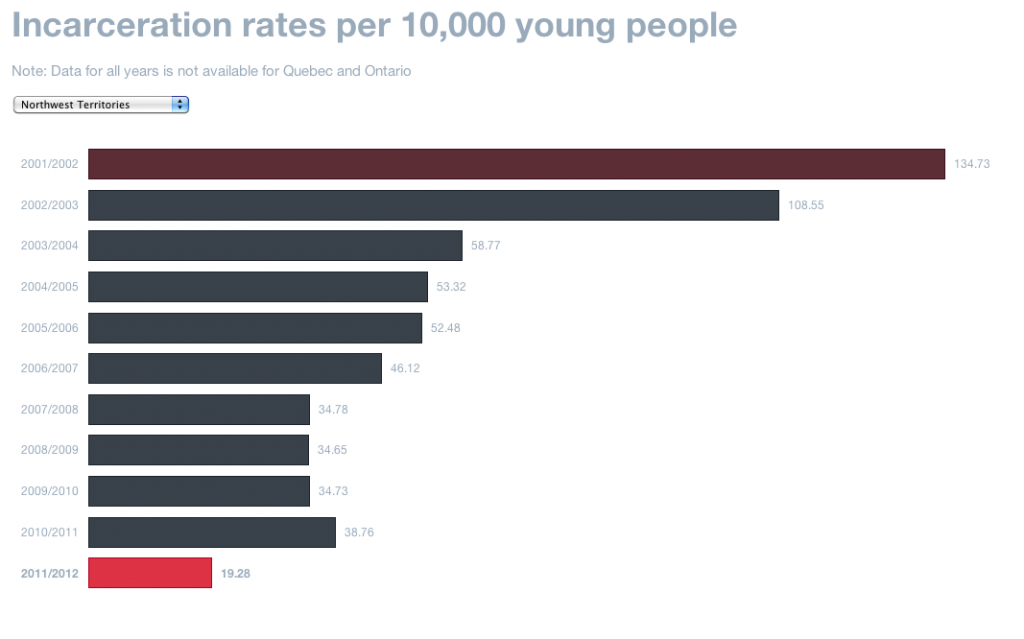
Provincially, B.C., Alberta, Manitoba, Ontario, Quebec, New Brunswick, the Northwest Territories and Yukon also have open data sites. (Click here for a comprehensive list of government-led open data portals in Canada.)

SEE BELOW: Canadian municipalities with open data portals

(source: datalibre.ca and data.gc.ca)

“They came out the door first, they were the ones who did the first open data portals,” said Lauriault.

These smaller-scale data portals can be invaluable tools not only for researchers but for advocacy and community groups to make “evidence-based” arguments and decisions, says Bianca Wylie, the co-founder of the nascent Canadian Open Data Institute.

Bianca Wylie (photo provided)

The institute’s mandate is to educate and connect stakeholders with open data in their communities. People looking for information on development permits, city planning or affordable housing might not call it “open data,” but usually, that’s what it is, Wylie said.

“To them, it’s just information,” she explained. “There are so many scales of what you consider data, a lot of the time it’s just information that’s sitting with the city. As an advocate, you want to make evidence-based arguments.”

While she applauded the federal and provincial governments and municipalities for their efforts, Lauriault said all levels of government still need to improve the kind of open data they provide.

“They’ve got some data, but they don’t have the hard stuff,” she said. “Do we fare well? I guess we do because we have lots of portals and lots of initiatives.”

“But are the really difficult data that we want available? No, they’re not.”
CanadaOpenData

Despite declining exports, Canada’s ‘beer economy’ still thrives

Share

By Erika Stark

Knocking back a cold one with dinner? So are most Canadians.

Though beer exports have decreased by 40 percent in the last decade, within the country, beer is still Canada’s favourite alcoholic beverage, according to Statistics Canada.

Last year, Canada exported $194,017,000 worth of beer to the United States, compared to $324,170,000 in 2003.

Chart Import Export

Canadian beer also gets exported elsewhere, but that information isn’t tracked by Statistics Canada, said Luke Harford, the president of Beer Canada, a national trade organization.

He attributed the decline to changing strategies in the North American brewery industry, as well as the economic downturn in the U.S.

“Declining exports are not a concern at this point as Canadian brewers are focused on selling beer internally,” Harford said in an email.

And it seems to be successful – last year, Canadians spent an average of $317 on beer, compared to $225 on wine, according to Statistics Canada.

“The beer economy stretches way back,” said Jacqueline Palladini, a senior economist at the Conference Board of Canada. “It’s one of the first industries that ever happened in Canada and it was certainly one of our first export industries along with the fur trade, so it has deep, deep roots.”

Jacqueline Palladini, senior economist with the Conference Board of Canada

According to a new report by the Conference Board, increasing beer exports by $10 million, or 3.5 percent, would support the creation of 70 jobs and an increase to Canada’s gross domestic product.

“It actually benefits Canada’s economy by $10.54 million and that’s because we have a lot of spin-off benefits,” she explained. “Each time (the beer) goes through a new industry, there’s value added, so the benefits end up being a bit more than what the actual value of the exports were.”

Harford said exploring other beer markets as well as a full economic recovery in the U.S. could help reverse the trend.

A nationwide industry

Cracking open a beer in Ontario has economic impacts in many other parts of the country, said Palladini.

“If you were to buy a beer in Ontario, the supply chain starts with malting and barley grown in the prairie provinces,” she explained. “Once that barley is grown, it has to be transported all the way to through the prairies to Ontario to be brewed. So you’ve already affected the agricultural industry and the transportation and warehousing industry.”

Though they join the supply chain a little later, imported brews also support a variety of industries, providing jobs in the transportation, wholesale and retail industries, says Palladini.

Imports on the rise

Beer imports themselves are trending in the opposite direction as exports. In 2012, Canada imported $593,555,698 worth of beer, with nearly half coming from either the U.S. or the Netherlands. Since 2003, they’ve increased nearly 77 per cent.

“Increasing import sales are not a bad thing as they generate interest and excitement for the beer category,” said Harford.

With an annual tax revenue of roughly $5.8-billion, Palladini says Canada’s beer industry is alive and well.

“It’s creating a lot of jobs and generating a lot of income.”

Header photo courtesy flickr user HeadRCrasher

Alta Vista, Beacon Hill top spots for car thefts, data shows

Share

By Erika Stark

If you live in Alta Vista or Beacon Hill-Cyrville, you might want to double check the locks on your car doors.

The two east-end Ottawa wards had the highest per capita rate of vehicle thefts in the last two years, according to crime data released by the Ottawa Police Service.

One hundred thirty-one cars, or about 28 per capita (10,000 people) were stolen in Alta Vista last year, up from 111, or 26 per capita in 2011.

In Beacon Hill-Cyrville, thieves stole 96 cars in 2012 and 84 the year before.

Across Ottawa, 1,253 cars went missing last year. In 2011, 1,122 vehicles were stolen.

“It’s a crime of opportunity,” said Erin Kelly, a communications specialist for the Canadian Automobile Association. “One thing people always need to remember is not to entice thieves and keep valuables and parcels from view.”

Erin Kelly, CAA North & East Ontario

“These are people who are looking for a quick opportunity and it can escalate from people who are breaking in for that valuable.”

Kelly said it’s not surprising that the two wards with the highest per capita rates of vehicle theft are both partly residential.

“A lot of people remember about parking lots and what to do, parking in a well-lit area and taking your keys with you,” she said. “But if you’re at home, there’s still a great risk, especially if you live in a residential area that doesn’t have a lot of pedestrian traffic.”

Kelly said using a locked garage is the best way to prevent car thefts at home. Parking facing the street can reduce the shadows thieves use to conceal themselves, she added.

“People feel safe at home. But at nighttime, there’s a lot of dark areas and if you’re not thinking about that, your car’s just as easy a target in your driveway as it could be in a downtown parking lot.”

The Ottawa Police Service’s crime prevention sheet for vehicle owners recommends many of the same precautions Kelly offered. It also states vehicle owners should never leave their keys – even spare keys – inside their vehicles. No one from the police service was made available for comment on this story.

Elsewhere in Ottawa, thirteen wards saw year-over-year increases in thefts, including West Carleton-March, where the per capita rate nearly doubled from 2011 to 2012. Conversely, Cumberland saw its own rate almost halved, dropping from 16 per capita in 2011 to nine last year.

Last April, police charged seven people in relation to the theft of over 100 cars between May and October 2012. The organized crime ring sold the vehicles, mostly minivans, to metal recycling facilities.

The solvency rate for car thefts in 2012 was just 17 per cent according to Ottawa Police Service’s crime, police and traffic statistics report. Of the 1,253 stolen vehicles, roughly 213 were recovered.

Back in Alta Vista, community association president Tony Bernard says the high rate of vehicle thefts isn’t a widespread community concern.

“Not in the time that I’ve been there, nobody’s ever brought it up,” he said. “It certainly hasn’t come up to the organization as something that we need to take action on.”

“Crime’s always an issue, I guess,” Bernard added. “But I certainly feel that the community is safe.”

It takes a village…

Share

How community justice programs are reducing youth incarceration and rebuilding partnerships in the N.W.T.


By Erika Stark

It still has one of the highest rates of youth incarceration in Canada, but fewer young people in the Northwest Territories  faced criminal records last year than they did a decade earlier, statistics show.

Community focus on restorative and rehabilitative justice measures, rather than criminal charges, has changed the way young people interact with the justice system in the N.W.T.

And, according to Statistics Canada, the youth incarceration rate has dropped 86 per cent between 2001 and 2012 – the largest decrease anywhere in the country.

It’s important to note that because of the small population of the territory, a year-to-year difference of a few people can significantly skew the data. For example, the data shows that between 2010/2011 and 2011/2012, the incarceration rate per 10,000 young people dropped by more than 50 per cent, and that’s because there were 15 young people incarcerated in the first year, and seven the next. Still, over the whole 10 years, the actual number of incarcerated youth has steadily gone down.

Click on the image for more information

It’s partly because of the change in Canada’s youth crime legislation 10 years ago, says Dawn Anderson, the director of the community justice and policing division for the N.W.T’s justice department.

Dawn Anderson, Director of the community justice and policing division

The Youth Criminal Justice Act, which requires police officers to consider extrajudicial measures such as warnings and referrals before charging people under 18, came into force in April 2003. The alternative measures cause less young people to end up in court and, possibly, in prison, she says.

It also means that the rates of youth incarceration nationwide before 2003/2004 are significantly higher because of the change in legislation. Still, the steady decrease in the N.W.T. speaks to the success of the territory’s community justice programs, says Anderson.

The extrajudicial approach is important especially in the territory’s smaller communities – some with less than 100 people, she says.

“People know each other,” says Anderson. “They’re able to draw on their strengths and the resources in their community to ensure the sentence fits and is feasible for the youth.”

When a young person is diverted from the court to a community justice committee, he or she will not have a criminal record, and his or her sanction will be tailored to what works best for the community, she explained.

“It allows for them to repair the harm to the victim and the community where the offence occurred,” Anderson says.

Thirty out of the N.W.T.’s 33 communities receive yearly funding from the community justice division to run their own programs, which also include crime prevention programs, relationship building, and what Anderson calls “on-the-land” cultural programming.

“There’s a strong focus on cultural and traditional activities,” she says, adding that strengthening relationships between youth and elders is another priority.

Requests for funding have become increasingly consistent throughout the territory, and Anderson says it’s a sign these programs are working.

“The biggest strength of the community doing this is that they’re resolving and addressing issues,” she says. “It empowers them to create a safer community and it creates a partnership. Collaboration is huge for us.”

Despite the drop, youth incarceration rates in the N.W.T. remain among the highest in the country and, at 19.3, are well still over the national average of 7.6. It’s a work in progress, says Anderson.

Her department is piloting a community safety strategy in Tulita, Hay River Reserve and Inuvik, and she says they’re constantly reevaluating their programs.

“We’re not only looking at the youth,” she says. “We’re looking at the adults, we’re looking at the victims, we’re looking at support services and making sure it’s culturally relevant.”

_____

LISTEN: Dawn Anderson describes how  community justice committees in the N.W.T. benefit youth.


Incarceration rates by province
Click on the image to see incarceration rates for all provinces