Data Story
Dec. 17, 2015
Tanya Molloy
Homelessness in Ottawa
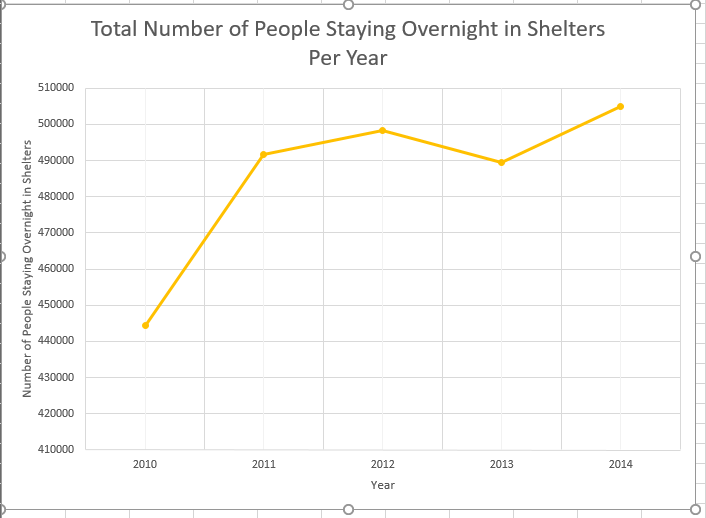
By studying the data on homelessness in Ottawa, organized and archived by the Alliance to End Homelessness Ottawa, one of the main key points that can be studied is the fact that homelessness itself, in Ottawa, is decreasing, whilst the average stay in shelters per night is increasing. It can also be studied that families stay in homeless shelters increasingly longer than men, women, and youth. Youth tends to spend the least amount of time in shelters.
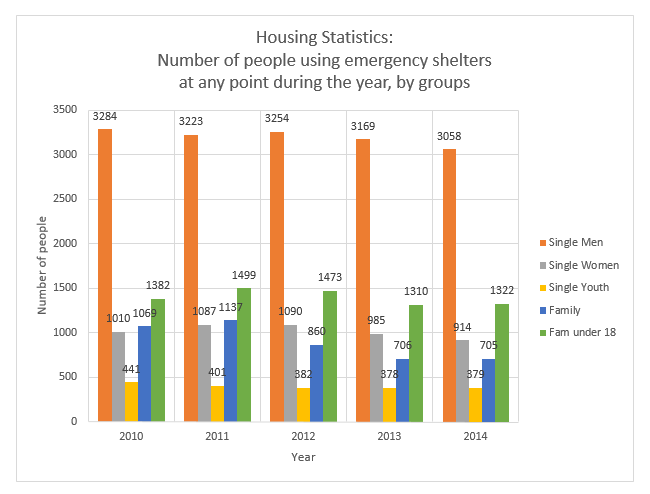
Tim Simboli is the chair of the not-for-profit alliance, and although he has seen signs of improvement for homelessness in Ottawa, a decade after his organization has started collecting data around homelessness in the city, is still not satisfied with the fact that the average length of stay in shelters in continuously going up since 2012, despite the total of homeless persons decreasing each year. Shelters were used by 6,520 people in 2014, which is 175 less than the year before, or a 2.6 per cent decrease.
However, there are more single homeless men than any other categories, including elderly people. Why? According to the Canadian Health Association, men are twice as likely than women to suffer from a mental disability, such as depression, bi-polarity, Alzheimer’s, etc. This would also explain why the second largest group to suffer from homelessness is the elderly, as people often begin to suffer from mental disabilities as they age. It has been proven that people who suffer from mental disabilities, and do not follow a strict treatment, are more likely to end up homeless.
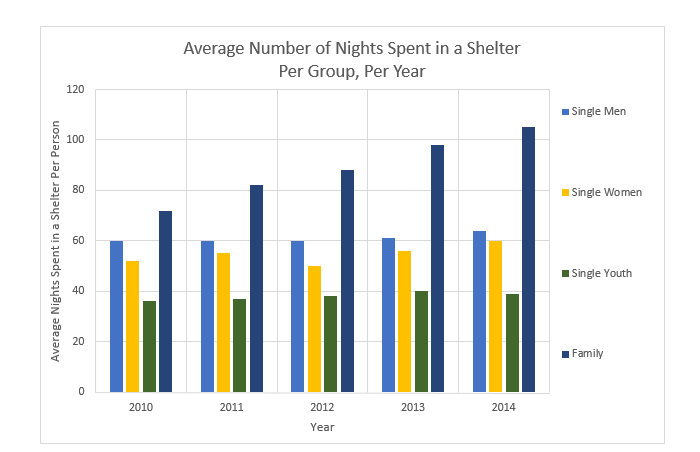
As well, the average length of stay can be related to the fact that there is a very high demand for affordable housing, yet not enough accommodations as such. There is an extreme shortage of affordable housing and rentals throughout Ottawa, especially for families who are in need of larger spaces, and elderly people (60+) who require special accommodations (wheel chair access, at home nursing, etc.).
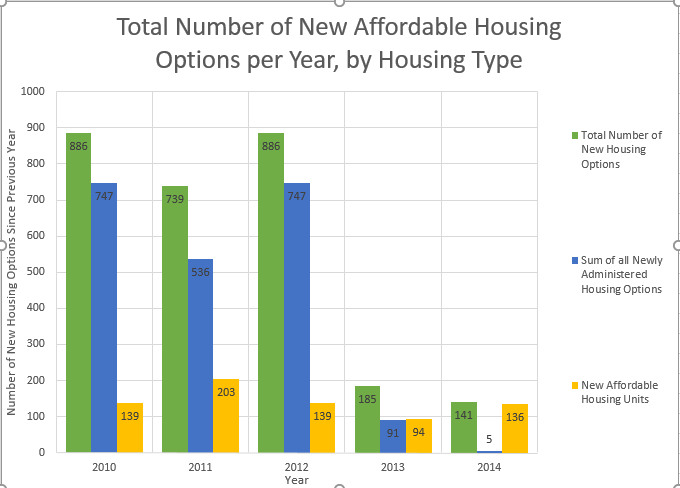
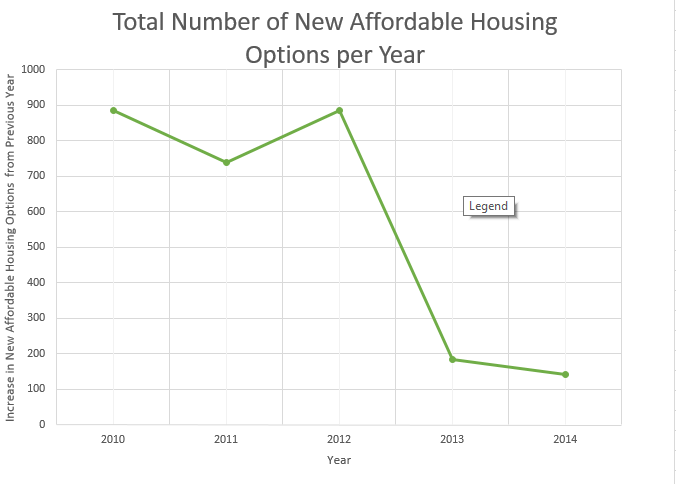
Continuing to study the affordable housing data, we can observe that the number of affordable housing in Ottawa is on the decrease since 2012. Every year, less and less housing is made affordable, yet the rent of regular places continues to rise. Both Mayor Jim Watson and Rick Chiarelli, councilor for the college ward, agree that there is a lack of affordable housing for low-income families and students, yet don’t seem to be putting much work into finding solutions. Not to mention that the government does not keep tabs on homelessness, and neither does Statistics Canada.
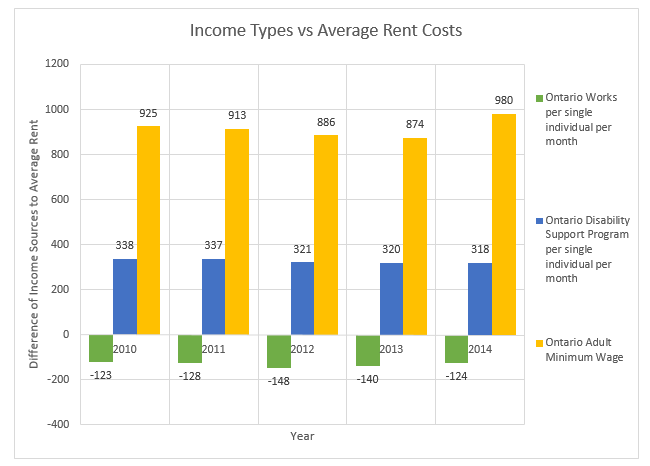
By studying the affordability data, we can see that the lowest source of income comes from people on the Ontario Works program. This is a social assistance program. If you are in temporary financial need, the Ontario Works program can provide you with money and help you find a job. However, Ontario works does not provide nearly enough income for someone to pay for the average rent of a bachelor in the city, which is an average price of 780, an increase of 65$, since 2010.
A person on the Ontario Works program, living in the average bachelor and receiving the average of 656$, would be missing 124$ each month in order to cover the rent. And that does not include anything else the person needs, like food, supplies, etc.
Meanwhile, a person on ODSP, Ontario disability support program, in place for people who are disabled and unable to work, would be receiving 1098$ a month, leaving them with 318$ to use each month.
Finally, a person making the minimum wage, working the average of 40 hours a week, every week of the month (160 hours per month), would be receiving 1760$, leaving them with 980$ to use after paying the rent.
By studying this data, we can see that someone on Ontario Works could technically be forced into homelessness, if they do not find a job within the first three months of staying in the average bachelor apartment in Ottawa, since there is not nearly enough affordable housing, and the numbers are decreasing each year, for everyone already on the waiting list.
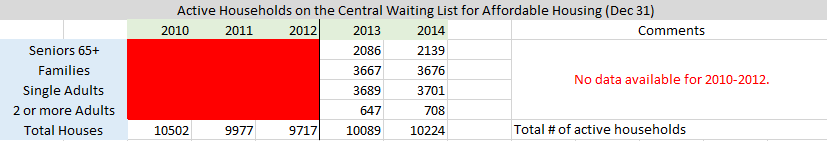
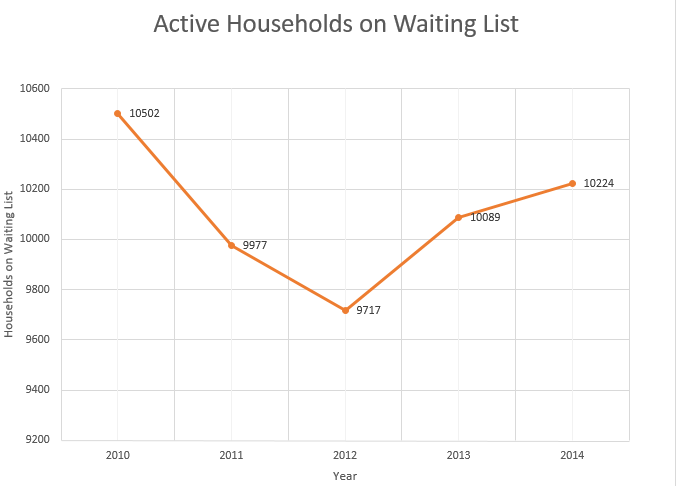
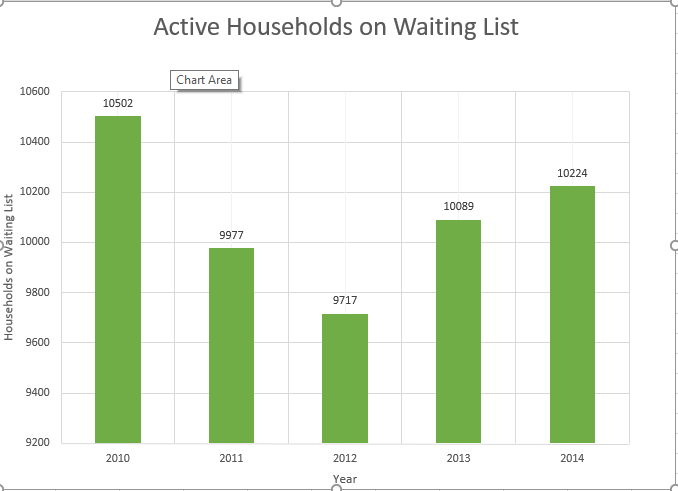
Finally, by studying the data of active households on waiting list for affordable housing, we can see that the number of people in need of low-priced housing has been increasing since 2012, whilst the earlier data of affordable housing options shows that the number of available housing is on the decrease. This will only increase the number of people on the waiting list in years to come if Ottawa does not find a way to create more supply for the demand.
*Disclaimer: It is important to note that in the housing affordability section of the Excel document, under new affordable housing, I had to make a lump sum of new rent supplements, new housing allowances, and other subsidies, in order to calculate the graphs used, since the 2010 and the 2011 data did not separate the values per group. As well, the data showed that there was no longer any funding of other subsidies after 2012. Finally, the data did separate the active households on waiting lists per group until 2013, and so I was unable to make the graphs per group. Instead, only the total number of households was used to compare the data.