Category Archives: Algonquin Assignment

Noise complaints by ward: Orlando Blacksmith

Share

Using the Open Data Ottawa website, I was able to find the monthly 311 service request calls in Ottawa broken down by month. As it only had data from January to September, I just used those nine months to show a visualization on noise complaints in Ottawa.

The reason why I chose noise complaints was because as I broke down all calls made to Service Ottawa by ward, noise was always among the top three biggest issues in the area.

After gathering all the data in the form of excel data worksheets, I used pivot tables to filter only wards and noise complaints.

I did this nine times, for every month, and added all the noise complaints together, sorted by ward.

Using this data, I was able to turn it into graphs and charts I could use to show my story, instead of just saying it.

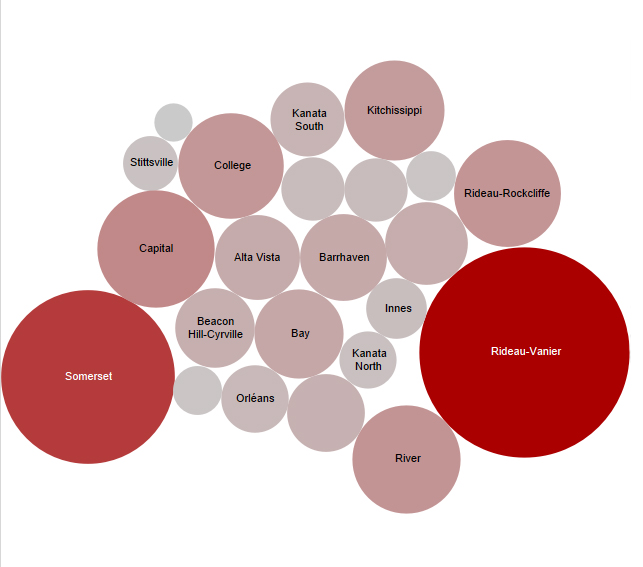
This was the result:

ward noise complaints ottawa
Noise complaints by ward, sorted from highest to lowest between January 2015 and September 2015.

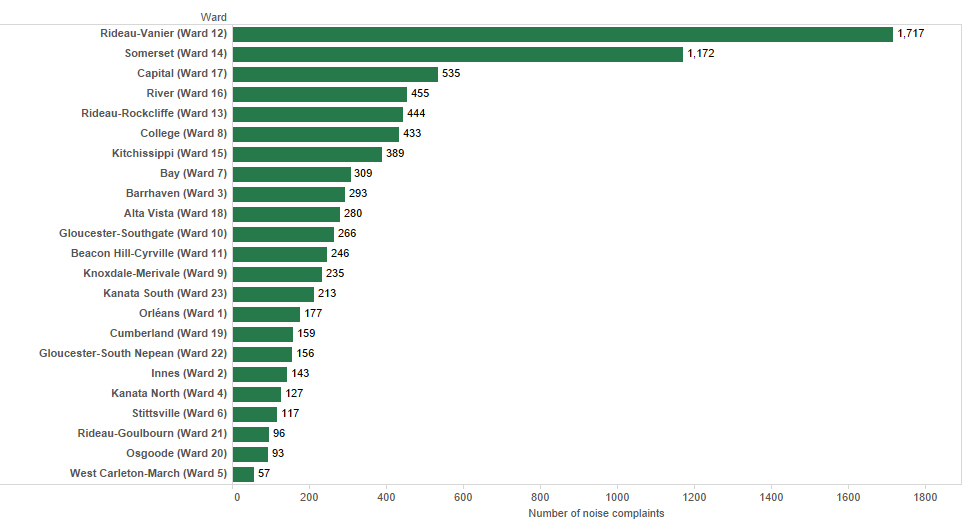
This graph was created using Tableau Public, which allows you to visualize any data you have.

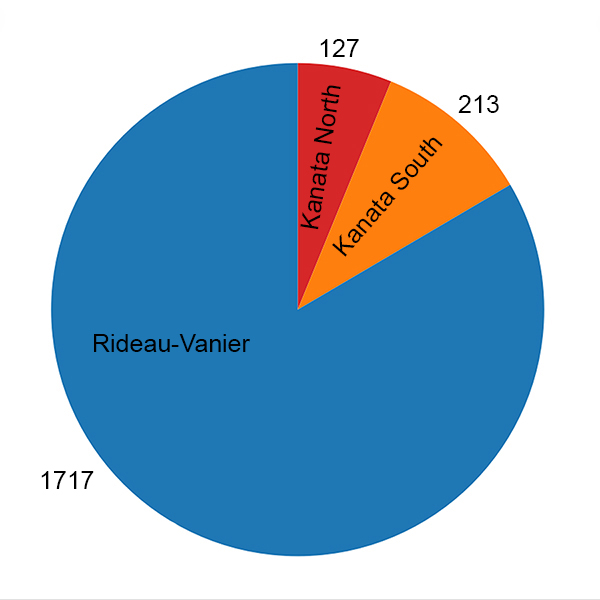
As you can see, Rideau-Vanier, ward 12, had significantly more noise complaints than everything else.

A theory I have for this is the fact that Rideau-Vanier is home to the highest crime rate in the city of Ottawa.

Articles detailing Rideau-Vanier’s high crime can be found here here here and here.

To better explain this would be to show it. Below you will find maps of both the Rideau-Vanier ward and the city of Ottawa, broken down into its 23 wards.

asdasdas
Here is a map of the Rideau-Vanier ward, found here.
sadasds
To put things into perspective, Rideau-Vanier is ward 12, which is just a small blip on the map.

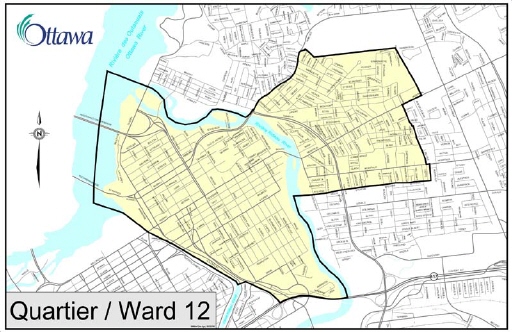
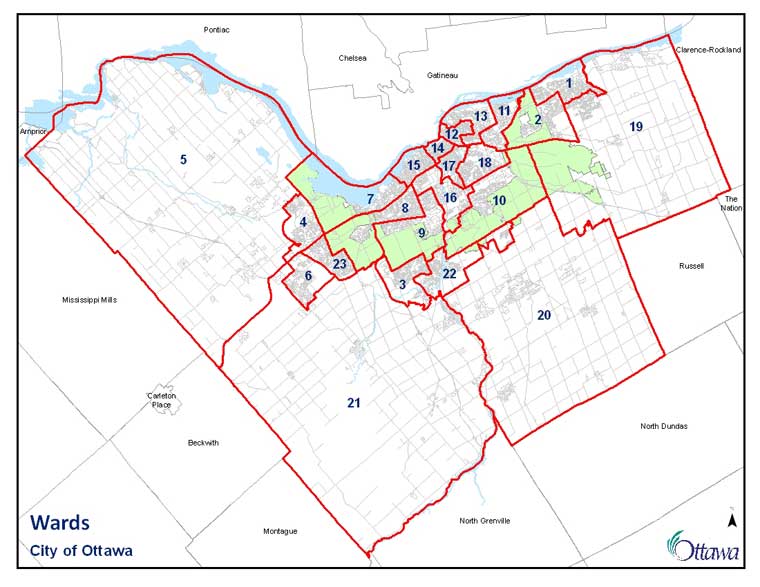
As you can see, Rideau-Vanier is just a tiny, tiny place in comparison to a lot of the other wards, yet it still has the highest noise complaints.

ottawa noise complaints by ward circle graph
This circle graph is to show where Rideau-Vanier stands among the other wards in terms of noise complaints.

It’s important to note that the  wards with the highest noise complaints are situated in the same area, downtown. Somerset, ward 14, Capital ward, ward 17, and Rideau-Rockcliffe, ward 13, are right beside Rideau-Vanier, the ward with the highest amount of noise complaints in 2015, so far.

Using this data, it’s clear that the majority of noise complaints come from the same urban heavy areas.

vanier vs kanata north and south
Another example of how Rideau-Vanier is miles ahead of every other ward in terms of noise complaints is this pie chart of how RIdeau-Vanier has more than five times more noise complaints than both Kanata South and Kanata North put together.

In conclusion, Rideau-Vanier is the noisiest ward among the 23 in Ottawa. Considering Rideau-Vanier is home to many homeless shelters and has the most crime in the city, it’s no surprise that this is the case.

My sources as well as data can be found here:

http://data.ottawa.ca/dataset/2015-311-monthly-service-request-submissions

http://ottawa.ca/en/city-hall/your-city-government/city-wards

http://www.ottawasun.com/2014/10/09/rideau-vanier-most-complex-ward-in-ottawa

http://ottawacitizen.com/news/local-news/rideau-vanier-vote

http://www.metronews.ca/news/ottawa/2015/07/23/its-no-surprise-rideau-vanier-has-most-crime-says-coun-fleury.html

http://www.ottawasun.com/2013/05/29/rideau-vanier-most-dangerous-area-in-ottawa

http://www.ottawapolice.ca/en/annual-report/resources/12-Rideau-Vanier_2012-2013_Crime_Trends_for_City_of_Ottawa.pdf

 http://www.davidmckie.com/rideau-vanier-assault-crimes-on-the-rise/

Ashley Moffatt final project

Share

I first gathered the data for the Public salary disclosure act for the last five years. There was no CSV available. So I had to take an HTML file and copy and paste that into Excel. Once I had all of my data, I began to sort it. First, I sorted it by school. Eliminating all of the other colleges from the list. Then I filtered it by profession. Eliminating everyone who did not have the word “president” in their title.

I had heard rumours that our old President, Robert Gillett, was still being paid by the college even though he hasn’t worked here in a few years.

Through filtering the data, I found out that this rumour is true. Gillette was paid over $100,000 in 2013, even though he is was longer president of the college at the time.

By obtaining data from the last 5 years, I was also able to see that he was paid over $300,000 at his peak earning. In comparison, Cheryl Jensen (our current president) signed a contract that entitled her to a $270,000 salary per year for five years.

I created a graph to show the growth of his salary over the last five years.

The graph shows Gillett’s salary, as well as his taxable benefits. When I spoke to the union about what that meant, they weren’t sure. They told me it would probably include a company car and cell phone. In 2013, when Gillett was no longer the president, his taxable benefits exceeded $40,000.

I attempted to contact Gillette to ask him about the deal he signed, but he never reached back to me. I did, however, hear from the union. They are very upset that the school is still paying him. They feel as though those resources could be better put to use. We could hire more part-time teachers, and more support staff.

They clarified that a contract like Gillett’s would not be signed today. Instead of officially stepping down, Gillette has been taking a “paid leave”.

I would not have been able to find this story had I not been able to sort through the data. Filtering the data allowed me to filter down the data to enable me to see the top earners at the school.

Links to original data:

2013: http://www.fin.gov.on.ca/en/publications/salarydisclosure/pssd/orgs-tbs.php?organization=colleges&year=2014

2012: http://www.fin.gov.on.ca/en/publications/salarydisclosure/2012/colleg12a.html

2011: http://www.fin.gov.on.ca/en/publications/salarydisclosure/2011/colleg11.html

2010: http://www.fin.gov.on.ca/en/publications/salarydisclosure/2010/colleg10.html

Ottawa bird-building collisions

Share

This map shows the hot spots for bird collisions with buildings in the city of Ottawa. The legend identifies the most common 10 bird species found in window strikes in Ottawa, with the remaining 83 species represented by black dots.

Source: Safe Wings Ottawa data, June 2014-Nov 2015.

This figure shows the ten most common bird species found in Ottawa building collisions. It shows the number of birds found by Safe Wings Ottawa as well as the percentage of total birds found by Safe Wings Ottawa.

Top 10 birds found in Ottawa window strikes(final)

Source: Safe Wings Ottawa data, June 2014-Nov 2015.

This figure shows local birds from the top 10 list that breed in the city of Ottawa. It compares the estimated Ottawa population of these species with the number found by Safe Wings Ottawa.

DataHero Birds that breed in the city of Ottawa - Copy

Source: Safe Wings Ottawa data, June 2014-Nov 2015., The Ottawa Bird Count.

This figure shows the weekly number of bird collisions recorded by Safe Wings Ottawa. We can see that the majority of bird hits happen during fall migration, with a few happening during spring migration. The reason for the large difference between fall 2014 and 2015 could be that volunteers became better at finding the birds, or that the warm temperatures, sunny days and high winds of fall of 2015 caused more migrating birds to hit windows.

DataHero Birds collisions in Ottawa by week

Source: Safe Wings Ottawa data, June 2014-Nov 2015.