Category Archives: CarletonDataJournalism3

Highest rise of visible minority population in Barrhaven

Share

(Photo| Marina Wang)

Barrhaven in Southern Ottawa has had the highest growth in the visible minority population according to an analysis of census data from Statistics Canada. Between 2011 and 2016, 4260 residents that identify as belonging to a visible minority (persons that are non-white or Aboriginal) have moved in to a census tract area that makes up the southern two thirds of the neighborhood.

Visible minorities now make up 43% of the residents occupying private households in the southern Barrhaven, compared to a city-wide average of 20%. Residents that identify as having a South Asian background made up the highest proportion of the visible minorities at 26%. This is followed by Chinese at 24%, Black at 14%, and Arab at 13%.

Click on a census tract area to see a demographic break-down

“It’s a very diverse community,” said Andres Leon, a young professional that moved to the neighborhood in 2014 with his family. “On my street you have people from Cuba, you have people from India, you have people from the Middle East. We’re from Colombia.”

Low housing prices is part of the reason Leon’s family decided to settle in Barrhaven. “We used to live in Kanata. It’s almost fully developed so the prices were higher for the houses but since Barrhaven is just developing there’s no real estate,” said Leon. “There’s more opportunities to get houses in that area for good value.”

The suburban neighborhood is around 20-kilometres from downtown which has posed challenges for Leon who doesn’t own his own car. However, being far from the Ottawa core provides opportunities for peace and tranquility, said Leon. “The thing that I love about the neighborhood is that I feel like there’s nothing better than being away from the city itself. It’s so quiet. It’s so safe.”

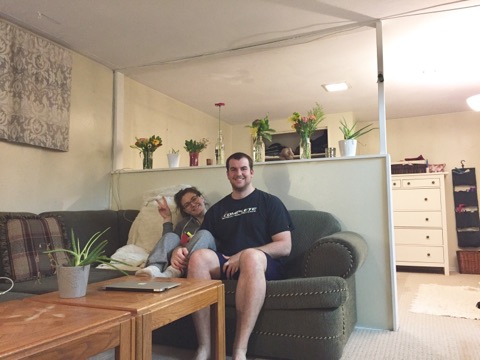
(Photo: Andres Leon was born in Colombia and moved to Barrhaven in 2014 | Marina Wang)

According to Alison Stirling, assistant to Barrhaven city councillor, many of the new residents are young families drawn to the neighborhood’s many local amenities, convenient location, and low cost of housing.

“There’s just an incredible amount of green space in the area,” said Stirling.  “The number of different parks is just astonishing.” Stirling also said that the ward has a high number of community associations, recreational sports teams and activities for children.

The ward contains 26 schools and five community recreation centres including the Minto Recreation Complex which contains a pool, ice rinks, and outdoor turf fields. The Barrhaven Town Centre, a shopping complex, includes a movie theatre and stores like Wal-Mart, Best Buy, and Cosctco.

Barrhaven city councillor Jan Harding is also working towards bringing more businesses to the area so that residents won’t have to commute long distances for work. For example, the Tomlinson Group, a construction company, will be moving their new headquarters to Barrhaven.

Another appeal to living in Barrhaven is that it can be easy to access other areas of Ottawa and is located close to highway 416 and close to the Fallowfield VIA Rail station for those that frequently commute to Toronto or Montreal. “It’s a cheaper way of life,” said Stirling. “Not everyone can afford living in Toronto.”

Stirling said that the diversity in Barrhaven isn’t immediately obvious, but that “for sure we are a multicultural community and a very welcoming community.”

(Photo: Barrhaven’s many schools and relatively affordable housing is attracting new residents to the area | Marina Wang)

“Barrhaven probably represents what Canada aspires to become on a national level: a true and thriving multicultural community,” wrote Andre Lefrancois in an email. Lefrancois runs a community news website called The Barrhaven Blog.

“Many different things attract people from various ethnic backgrounds to Barrhaven. Our new mosque and synagogue have certainly played an important role, as have the quality of our schools and growing business sector. But I think that at a certain level, people who come from different ethnic backgrounds want to live in a multicultural community – one where residents respect each other based on values, not religion or race,” wrote Lefrancois.

Flood of immigrants to Barrhaven receive warm welcome

Share

2016 saw a flood of immigrants settling in Ottawa’s Barrhaven neighbourhood, according to data from the 2016 Immigration Census.

In 2011, Barrhaven saw around 2500 immigrants, while in 2016 there were just over 4000. That’s an increase of 61 per cent. Barrhaven has a population of around 70,000, as of 2011.

The darker the area, the higher the number of immigrants. Barrhaven (lighter blue) and the surrounding area (darker blue) make up one of the largest increases between 2011 and 2016.

That flood of newcomers has prompted the Barrhaven community to open its arms.

The Ottawa Chinese Community Service Centre (OCCSC) puts on the Barrhaven Community Welcome Fair every year, where local businesses show up and help welcome newcomers to Canada.

The OCCSC was founded in December 1975 to satisfy a growing need to support Chinese immigrants.

Despite that, half of the people in the programs OCCSC offers aren’t Chinese, Robert Yeung of OCCSC says. OCCSC helps any and all newcomers to Canada, extending their language and employment services to all.

It’s not just the OCCSC that’s helping Canadian newcomers. The Ottawa Community Immigrant Services Organization (OCISO) is also helping immigrants to the Ottawa area.

OCISO Logo/ociso.org

Dragana Mrdjenovic is the Settlement and Integration Manager at OCISO. She helps Ottawa immigrants to get their bearings and settle seamlessly into their chosen communities.

Mrdjenovic knows exactly how immigrants feel.

“Moving to a completely new country is a risk,” Mrdjenovic says.

Mrdjenovic immigrated from Serbia nearly 30 years ago.

Mrdjenovic also has experience with employment counseling and helps new Canadians to find jobs, or even start their own businesses.

Entrepreneurial immigrants aren’t an oddity, either. Ottawa presents an Immigrant Entrepreneur Award every year to celebrate a select business owner.

Barrhaven’s own Ysabel Li-Lopez, founder of Nurture-Elle, a company that creates nursing products for pregnant women, is an immigrant from Peru. She won the award in 2013.

The number of new permanent residents to Canada will increase dramatically in the next three years.

Immigration Minister Ahmed Hussen and the Liberal Government propose welcoming 310,000 new residents in 2018, 330,000 in 2019 and 340,000 in 2020 for a grand total of about 1 million by 2020, according to the 2018-2020 Immigration Levels Plan.

Modest Ottawa Community Accounts for Region’s Most Visible Minorities

Share

In a country that prides itself on its diversity, a small Ottawa community is leading the way in the nation’s capital, according to an analysis of 2016 Census data.

Half Moon Bay-Stoneridge is a group of neighbourhoods located south of Barrhaven, an Ottawa suburb. Previously referred to as “New Barrhaven”, the newly-developed area saw the highest population growth out any of any Census tract in the Ottawa-Gatineau area between 2011 and 2016. The overall population of Half Moon Bay-Stoneridge more than doubled. That is an increase of over 8,000 people, more than half of which was made-up of visible minorities.

The map below is zoomed in on the Ottawa Census tracts. The dark colours represent the areas of highest increase of visible minorities in population between the years 2011 and 2016.

The city of Ottawa’s municipal boundary titles are layered on top of the Census tracts to better-show the tracts locations in the region.

Clicking inside the Census tract boundaries produces a pop-up box with the number of visible minorities in the area for 2011 and 2016, along with the increase or decrease between the years. Half Moon Bay-Stoneridge is located south of the Gloucester-South Nepean title on the map.

Source: Statistics Canada

Despite being Ottawa-Gatineau’s highest growing tract in population, Half Moon Bay-Stoneridge, geographically, only makes up less than 0.5% of the region. (A surface area of under 29km2, compared to Ottawa-Gatineau’s 6,700 km2).

Zijad Delic, an Imam at the SNMC Mosque and Muslim community organization in Barrhaven, describes the area as “safe, family-oriented”.

“Ottawa is one of those unique cities. The multiculturalism is very established,” said Delic.

During the five-year span between the 2011 and 2016 censuses, the area’s visible minorities population grew by over 4200 people. The number of visible minorities living in Half Moon Bay-Stoneridge was up to 7220 as of last year, the most living in any one census tract in the Ottawa-Gatineau Area.

Imam Zijad Delic has lived in the Ottawa area for over a decade and says its diversity and acceptance has improved greatly in recent years. (Provided)

Although SNMC is located just outside of the Half Moon Bay-Stoneridge area (about a ten-minute drive away), Imam Zijad says that he has noticed Ottawa’s diversity grow in suburban communities like it over the last five-to-six years.

“Diversity has become a trademark of this community,” said Delic.

The biggest demographic of visible minorities in the area is South Asian (1920 people), which grew by nearly 1200. The area also saw an increase of almost 3000 immigrants during the five-year span.

“Canadian diversity is very unique. It is managed fairly on the national level through multicultural policies that provinces, and then the municipalities, have taken mostly well,” said Delic.

A driving factor behind its increase in population is the area’s recent urban development, says the City of Ottawa’s Planning and Development Office.

According to Royce Fu, a City of Ottawa planner, the census tract is part of an area that accounted for nearly a fifth of Ottawa-Gatineau’s development between 2011-2016. The city planner’s office tracks development by sub-area. The sub-area that is made-up of Half Moon Bay-Stoneridge and Barrhaven, called “South Nepean”, accounted for 18% of the region’s new housing units.

“From year-end 2011 to year-end 2016, South Nepean was the fourth largest growing sub-area behind Leitrim, Riverside South, and the Central Area,” said Fu.

According to Fu, South Nepean is still one of Ottawa’s highest developing areas. In the first half of 2017, the area accounted for over 15% of the region’s development.

Between the two Census years, Ottawa as a whole saw an increase in about 45,000 people who identified themselves as visual minorities. The area now has a visible minority population of over 280,000, meaning about one in five of the overall Ottawa population.

“By the nature of being the capital, if Ottawa is not going to embody diversity, then who else will?” said Delic.

Rent near Carleton University has gone up 56 percent according to recent census

Share

By Hayley Kirsh

According to an analysis of the most recent census data released by Statistics Canada, the median monthly rent price in the residential area just East of Carleton University has gone up 56 per cent between 2011 and 2016. The current average rent in the area for a two-bedroom apartment is $1,294 according to the Canada Mortgage and Housing Corporation’s (CMHC) annual survey.

In comparison, surrounding areas showed percentage increases much lower like 18 per cent and 28 per cent.

This map outlines the census tracts of the City of Ottawa, darker areas show the highest percentage increases in median rent from 2011-2016. To the right of the Carleton University Marker you will see the Old Ottawa South area in dark blue.

Source: Statistics Canada

The area, known as Old Ottawa South is home to a mix of families, students and retirees. It is especially sought after by university students because of its close proximity to Carleton University and shopping amenities like Billings Bridge and Lansdowne Park.

In her basement, bachelor apartment that she shares with her partner, Carly Parks, a 4th year Public Affairs and Policy Management student at Carleton University explains, “Rent is astronomical in this area, and would be unaffordable if I didn’t split costs with my partner.” Parks describes the $850 unit as “one room with a kitchen off the side and some storage.”

Carly Parks with her Partner Eric DeHaas in their bachelor apartment. Picture by Hayley Kirsh

According to the CMHC annual survey, in 2016, bachelor apartments in the Old Ottawa South area cost on average $842 per month compared to 2015 where the average was $775 per month. Bachelor apartments in other Ottawa neighbourhoods like Chinatown cost on average $790 per month.

Meaghan Beale, another Carleton student moved out of the Old Ottawa South area into the area just North by Chinatown because of the cost of rent and substandard living arrangements. “The landlord kicked everyone out of the building to renovate one year (except my unit, because the other tenant at the time refused to leave).” She continued, “My unit was a mess; I think the landlords wanted to keep it that way so the people living there would leave voluntarily.”

Ian Grabina is the ward office liaison for Old Ottawa South, he manages and coordinates resident issues in the area with the Capital Ward councillor David Chernushenko. Grabina says high rent and substandard living arrangements is an issue plaguing many neighbourhoods adjacent to schools like Old Ottawa South. “Single family homes are being converted to triplex’,” he says. “The challenge then becomes, that students are willing to live in these inappropriate builds, with some having upwards of seven to 10 bedrooms per residence.”

“It’s a challenging situation.” He continued, “We’re trying to control the number of bedrooms one would see going into a triplex.” Over the summer, an Interim Control Bylaw was put in place by the City of Ottawa to temporarily halt the development of multi-unit dwellings in areas like Old Ottawa South and Sandy Hill (residential area beside University of Ottawa). In the meantime, according to a September 13 city council meeting, the City is trying to come up with some restrictions for multi-unit dwellings in residential neighbourhoods.

Dominique Milne, a real estate broker in Old Ottawa South says, “The resale market in the area has gone up, so landlords have to cover their costs in terms of mortgage payments.” The Ontario Residential Tenancies Act states that landlords are only allowed to increase rent by market rent for newly signed leases. Market rent is the estimated amount a property with a certain number of bedrooms, in a certain area, will rent for according to the Ministry of Housing. The 2017 market rent value allowed for an average percentage increase of 1.5 per cent.

Rent is on the rise across the city says Grabina, and as long as there are students hoping to stay close to school, landlords are able to charge more for less.

Housing costs still a problem in Ottawa


Brent Rizzo, 57, outside his Barrhaven home (Nov. 13, 2017)

Being a homeowner in Ottawa isn’t cheap. For those like Brent Rizzo, who rents out his properties to students, it can be difficult keeping up with the cost of maintaining each home.

In a recent analysis of the Statistics Canada census, there was a slight decrease in the amount of homeowners who spent over 30% of their income on housing costs between 2011 and 2016.

In 2011, there were 4,098 homeowners who were forced to spend over a third of their income. Meanwhile, in 2016 that number has dropped 2% to 4,003. The spending that is tracked includes monthly payments, rent and any repair costs that a home might need.

Rizzo does not fall into the 2% that have seen fewer costs as his continue to rise each year. So much so that he is being forced to raise the price on houses that he rents to students.

“It’s unfortunate, I’m a fair guy but each year my budget gets tighter and tighter,” said Rizzo on the porch of his home in Barrhaven.

Rizzo says that although many may struggle with house payments his real issue lays in house repairs. Since 2012, the amount of money he spends on fixing his houses increases significantly each year. Three of the houses that he rents were built earlier than 1945 and are starting to become a serious problem for the 57-year-old.

“Things break down after time, whether it’s the furnace or the water pump. Replacing those can be costly and it’s happening more frequently,” said Rizzo.

A major issue for Rizzo was the amount of rain that has experienced in 2017. Ottawa has felt a record number of rainfall throughout the year. By October the city had surpassed the 12-month record set in 2006. The worst of those months was July where nearly 250 millimetres of rain came pouring down.

Rizzo called this year’s span of April to July the “summer of torture” as him and his sons had to repair leaks and shingle damage on two of his houses. Although he does all home repairs he says that the price is becoming too much.

“Doing the work ourselves saves us money, but a downside of owning a house in Ottawa is how much they get beat up by the rain and snow,” said a frustrated Rizzo.

He also mentioned that because of the impact of the weather he needs to raise his price of rent next May to make up for the costs.

Below is a map highlighting the differences of owners who spent 30% or more of their income on housing costs from 2011 to 2016. Purple means a percentage increase, while brown represents a decrease.

All blank areas were not tracked by the latest census.

Source: Statistics Canada

One of the areas affected by the largest increase in high housing costs is Heron Gate, which is located within the Alta Vista ward. In the 2011 census there were no recorded homeowners that spent over 30% on housing costs. However, in 2016 that number grew to 55, which is the largest growth in a particular area throughout Ottawa.

Rizzo is no stranger to that statistic as he rents out a home on Walkley Road and has seen the area develop.

“It’s a very nice area filled with development and lots of apartment buildings. I find students aren’t as willing to live there because of how expensive it can be,” said Rizzo.

Places that show a reduction included western wards such as Stittsville-Kanata West and West Carleton March. Also within the city, much of Rideau-Rockcliffe saw a lower amount of homeowners who had spent 30% of their income on housing costs.

Correlation Between Rent Increases and Percentage of People Spending 30 Per Cent or More on Monthly Rent

Share

This map is based on the percentages of median shelter cost increases in Ottawa. The darker colours represent higher rent increases, while the lighter colours represent lower rent increases. You can click on the different areas to see graphs that better represent the rent increases, and use the search function to search for certain neighbourhoods in the Ottawa area.

Some areas are blank, which is either because there is no data for them, or they are areas without inhabitants.

Median shelter cost rose more than 15 per cent in Ottawa between 2011 and 2016, according to an analysis of the latest Canada census data. According to the same data, the number of Canadians spending more than 30 per cent of their income on shelter cost has also increased.

For renter households, shelter costs include, where applicable, the rent and the costs of electricity, heat, water and other municipal services.

The Canada Mortgage and Housing Corporation considers housing affordable if the shelter costs are less than 30 per cent of household income.

The median differs from the average, and is just the middle value in a set of numbers. In this case, the median is the middle percentage between the highest and lowest numbers in rent increases in Ottawa.

These trends were most common in two types of areas in Ottawa: areas closest to the downtown area, and growing suburbs on the outskirts of the city. Suburban areas like Barrhaven and Orleans as well as more urban areas like the Capital region and Westboro reported the highest per cent increases, with most of the downtown areas reporting slight increases as well.

According to Anne-Marie Shaker, a senior market analyst at the Canada Mortgage and Housing Corporation, when choosing a place to rent, there are a variety of factors to consider: “people choose different accommodations depending on their preferences for things such as area, prices, commute to work, family size etc. and their preferences for rental versus homeownership.”

For Cassandra Maier, a French student at Carleton University, she made the decision to move downtown because it meant a shorter commute time from her job as a tour guide at the Canadian Mint, from her parents’ house in Orleans. She moved to Lees Avenue, close to Nicholas Street in downtown Ottawa. In this area, about 49 per cent of renters spent more than 30 per cent of their income on shelter costs.

The median rent in the Lees area is about $1200. Cassandra says that she paid $800 per month in her shared apartment. Although Maier made more than minimum wage in her job as a guide for the Canadian Mint, she was still spending the majority of her paycheques on shelter costs. “I was spending about 40 per cent of my income just on rent,” Maier confessed. “It was a little crazy.”

Cassandra Maier, a Carleton University student, rented an apartment on Lees Avenue, but the high rent prices forced her to leave at the beginning of the summer. Photo provided by Cassandra.

According to a document distributed by the Advocacy Centre for Tenants Ontario, Ontario renters have a much lower median income level, $36,000 annually, less than half that of homeowner households, who have a median income level of $81,000 annually. In the same document, renter households are also more likely to spend more than 30 per cent of their income on housing costs. In Ottawa, renter households make up about 34 per cent of all homes, according to Statistics Canada data.

High rent costs can be due to location and demand. As Shaker explains that “prices could be rising in some areas because demand is outpacing supply in that particular area.”

So what does the future climate look like for Ottawa renters?

In 2016, Ontario landlords were allowed to raise their rents by 2 per cent, while in 2017, there is a slight decrease, with them being allowed to raise their rent by 1.5 per cent. The average rent increase between 2011 and 2017 was 1.7 per cent, making the 2017 number slightly below the average price raise. The amount to increase the rent by each year is calculated using the Ontario Consumer price index, which measures costs of food, energy, clothing, transportation and other items to determine how much of an increase is appropriate.

Despite the average increase in rent raises, would Cassandra still recommend her apartment to a friend? Yes, but with one condition. “I would recommend it for someone who had or was making enough money!” Cassandra declared. “It just got too expensive after a while.”