
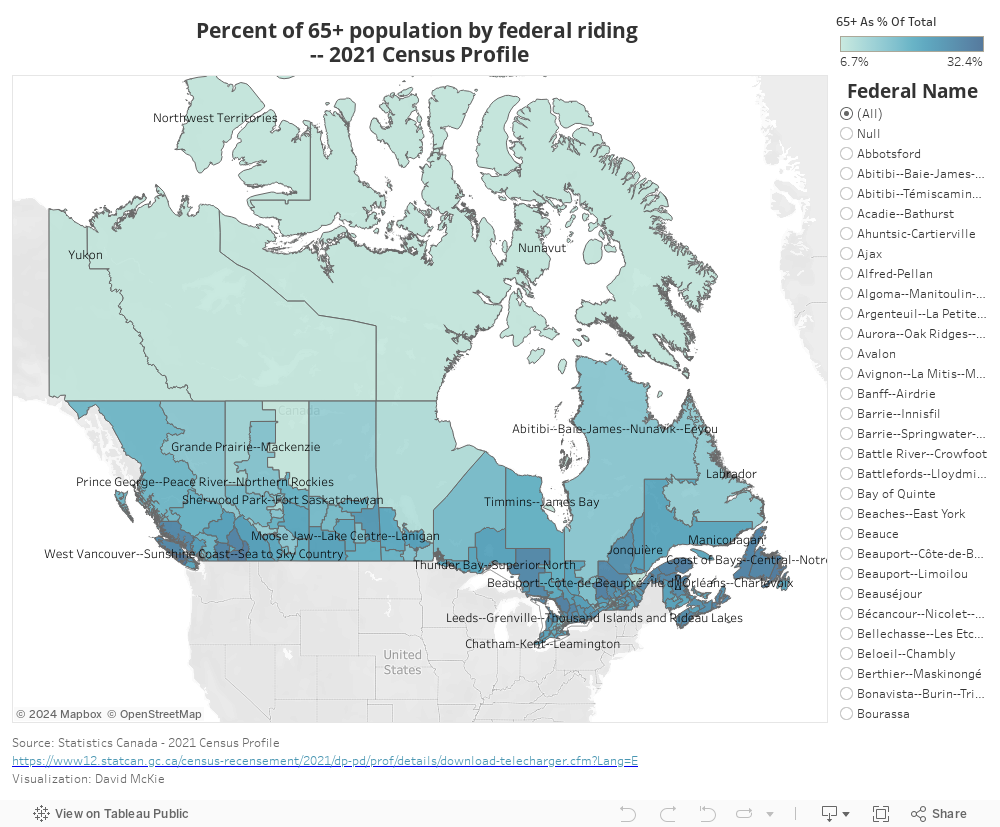
Statistics Canada released the second dataset from its 2021 census. The general takeaway? Canada is aging, with StatCan reporting our population 65 and older grew 18.3 per cent, for a total of seven million. The agency says the increase is the largest in 75 years. To give you a sense of how this demographic is distributed, we have calculated the 65-plus cohort by federal ridings.
(To see the percentage of people over 65 in each federal electoral district, click a riding on the map. To return to the original view, click outside the map. To get an even closer view of an electoral district, select the checkbox to the left of a specified riding in the “Federal Name” menu. When the district appears on the map, hover your cursor over the area to see the percentage. To return to the original view, select the “All” button.)
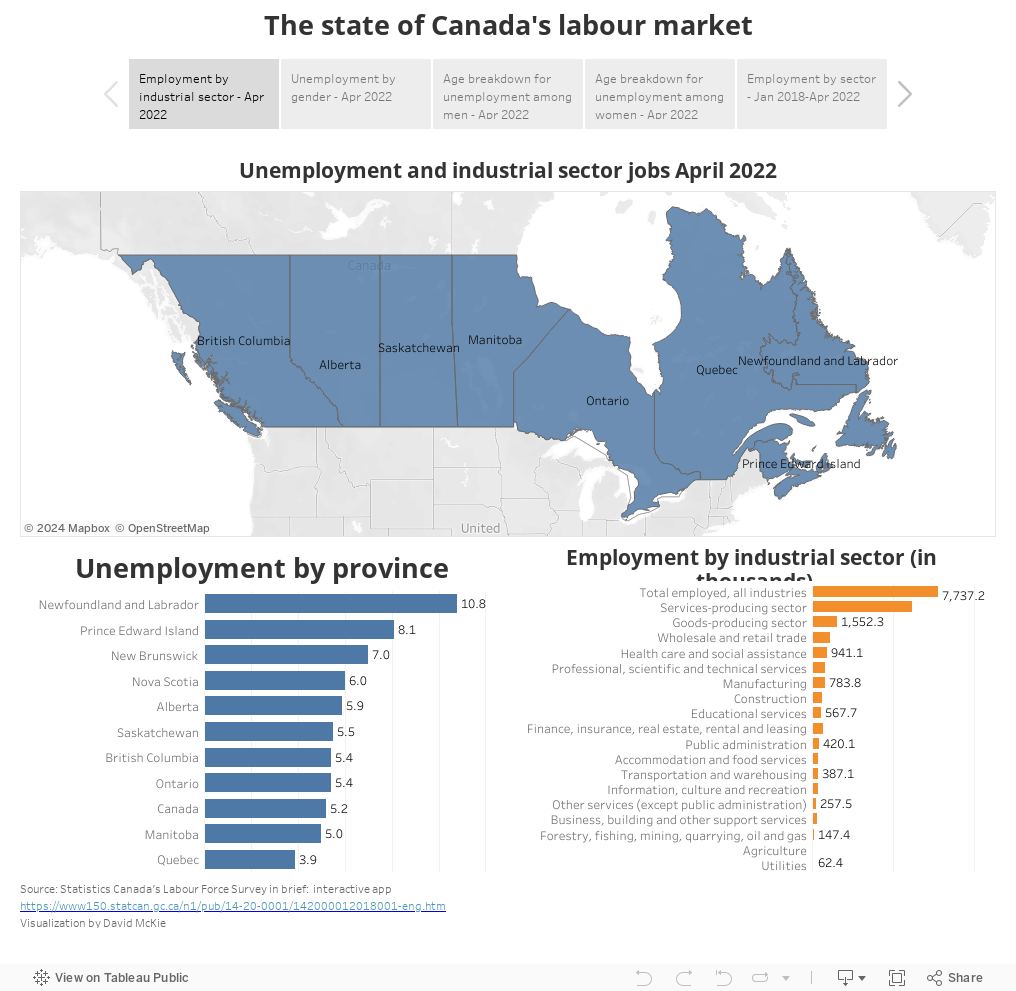
Statistics Canada’s most recent Labour Force Survey painted a positive picture for Canadians’ job prospects, as the country seems to be emerging from the pandemic, despite fears of a sixth wave. The unemployment rate is falling, and sectors such as services, retail trade and health care are picking up after two years of near dormancy. Federal wage subsidy support helped keep thousands of businesses afloat for the past two years, which may help explain why insolvencies among corporations and small businesses continue to decrease.
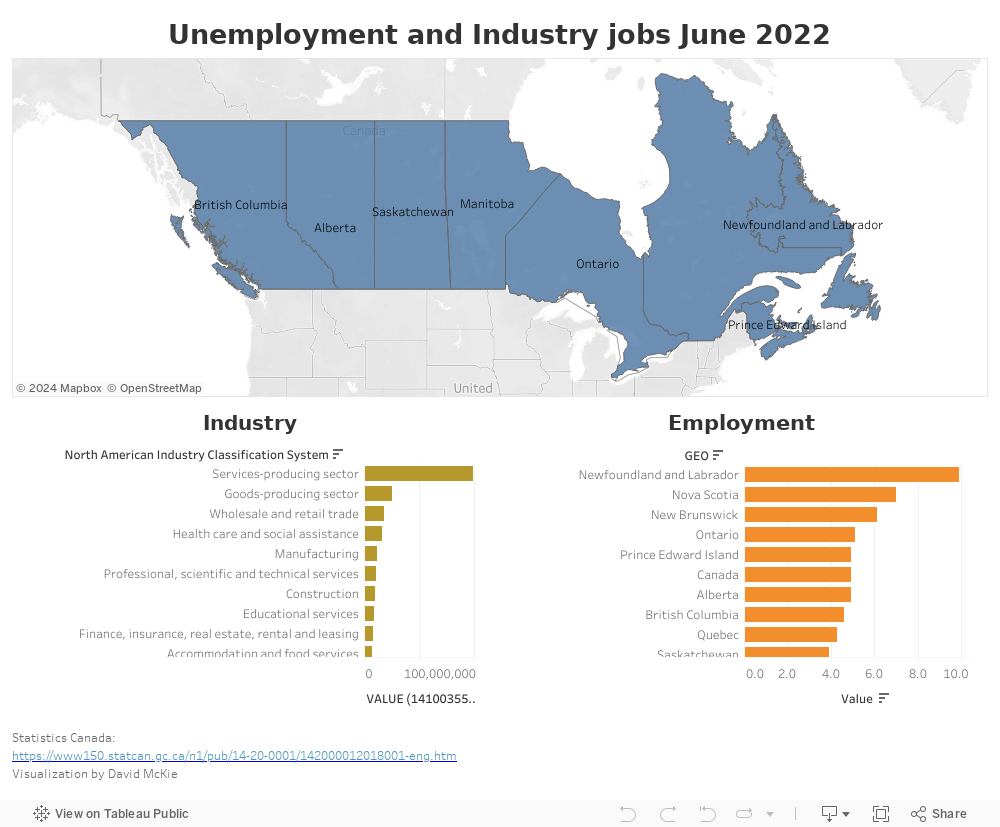
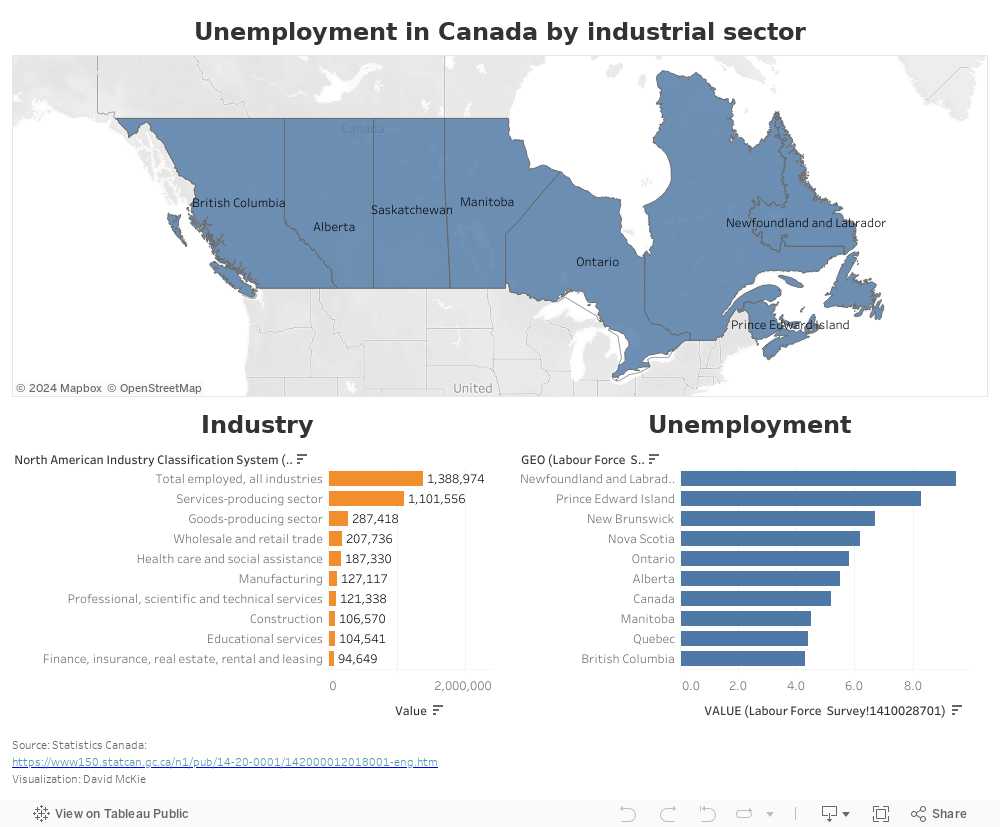
The story map below — updated to include StatCan’s May 6 release — helps break down what’s happening. First, there’s an interactive dashboard tracking unemployment across the country, displaying the unemployment rate and job numbers by province (the territories are not part of this dataset) for March, the most recent month available. You can click the subsequent tabs for other visual stories, ending with a breakdown of growth by sector from Jan. 1, 2018 to Apr, 2022.
(For the interactive dashboards on the first two tabs, click a province to see the corresponding values in the tables below. Click outside the map to return to the original view. For the last three tabs, you can make a selection from the menu on the right. The default value for age is 15 years and over.)