
This map shows the hot spots for bird collisions with buildings in the city of Ottawa. The legend identifies the most common 10 bird species found in window strikes in Ottawa, with the remaining 83 species represented by black dots.
Source: Safe Wings Ottawa data, June 2014-Nov 2015.
This figure shows the ten most common bird species found in Ottawa building collisions. It shows the number of birds found by Safe Wings Ottawa as well as the percentage of total birds found by Safe Wings Ottawa.

Source: Safe Wings Ottawa data, June 2014-Nov 2015.
This figure shows local birds from the top 10 list that breed in the city of Ottawa. It compares the estimated Ottawa population of these species with the number found by Safe Wings Ottawa.
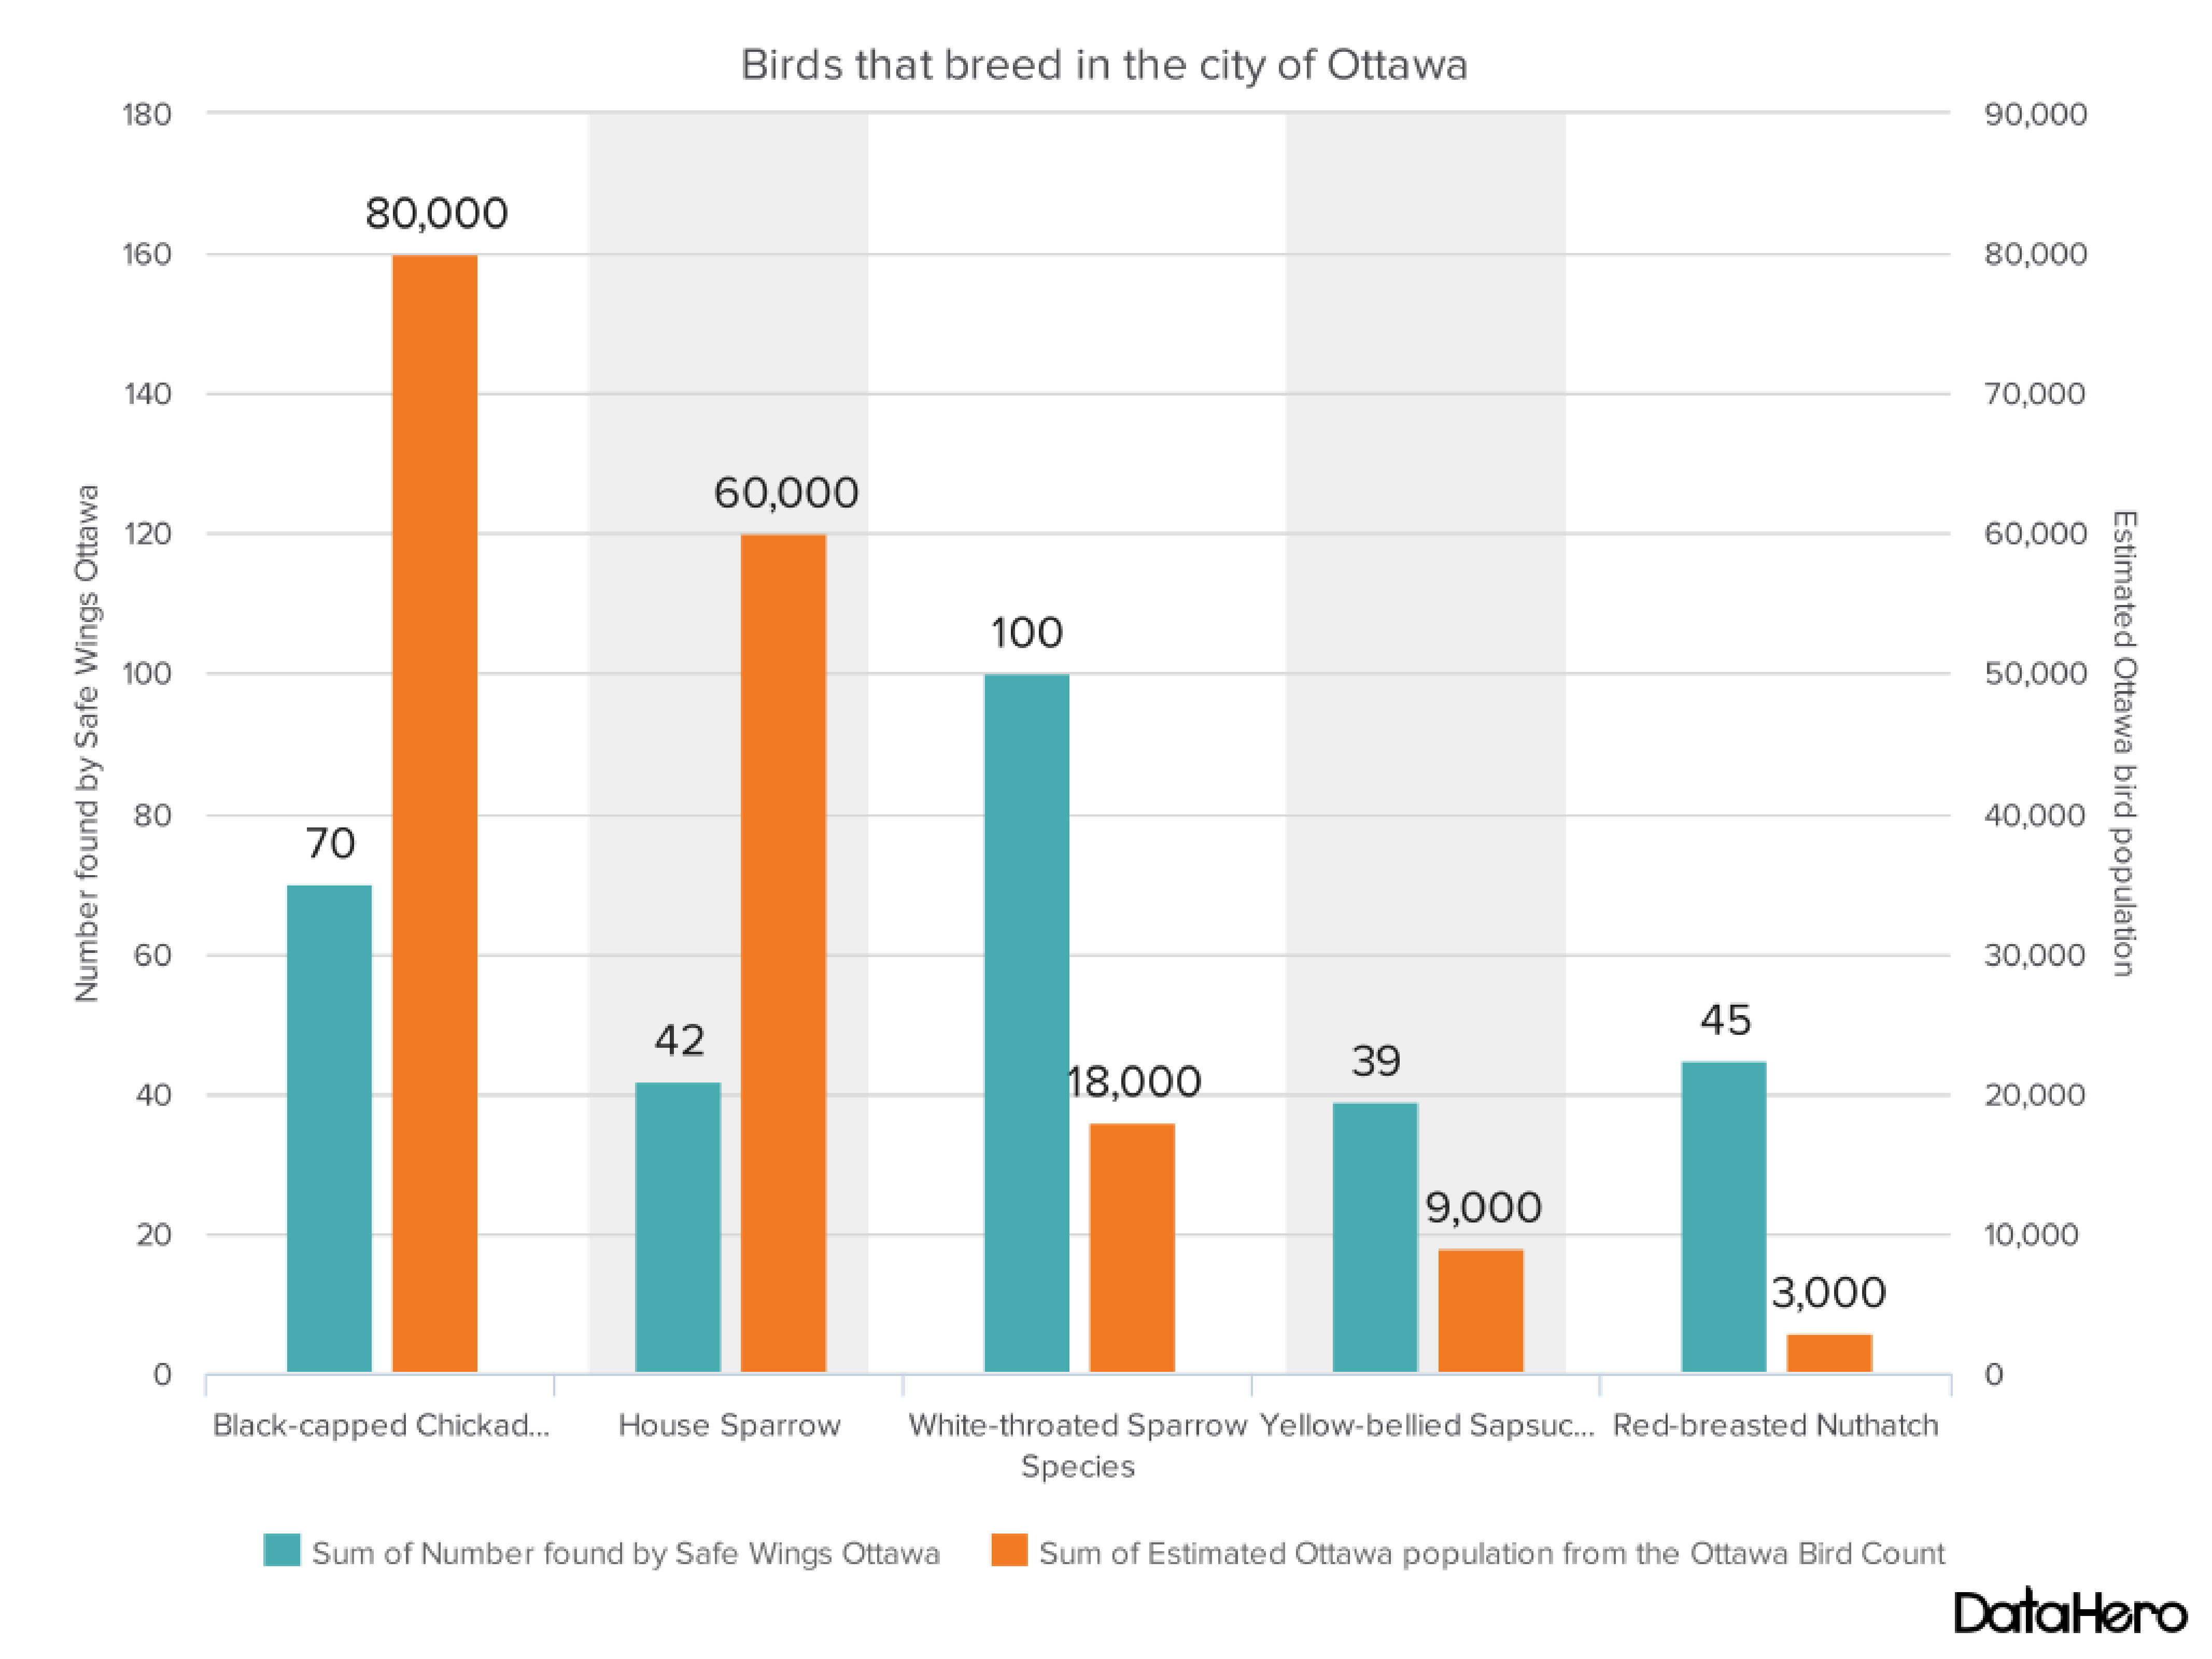
Source: Safe Wings Ottawa data, June 2014-Nov 2015., The Ottawa Bird Count.
This figure shows the weekly number of bird collisions recorded by Safe Wings Ottawa. We can see that the majority of bird hits happen during fall migration, with a few happening during spring migration. The reason for the large difference between fall 2014 and 2015 could be that volunteers became better at finding the birds, or that the warm temperatures, sunny days and high winds of fall of 2015 caused more migrating birds to hit windows.
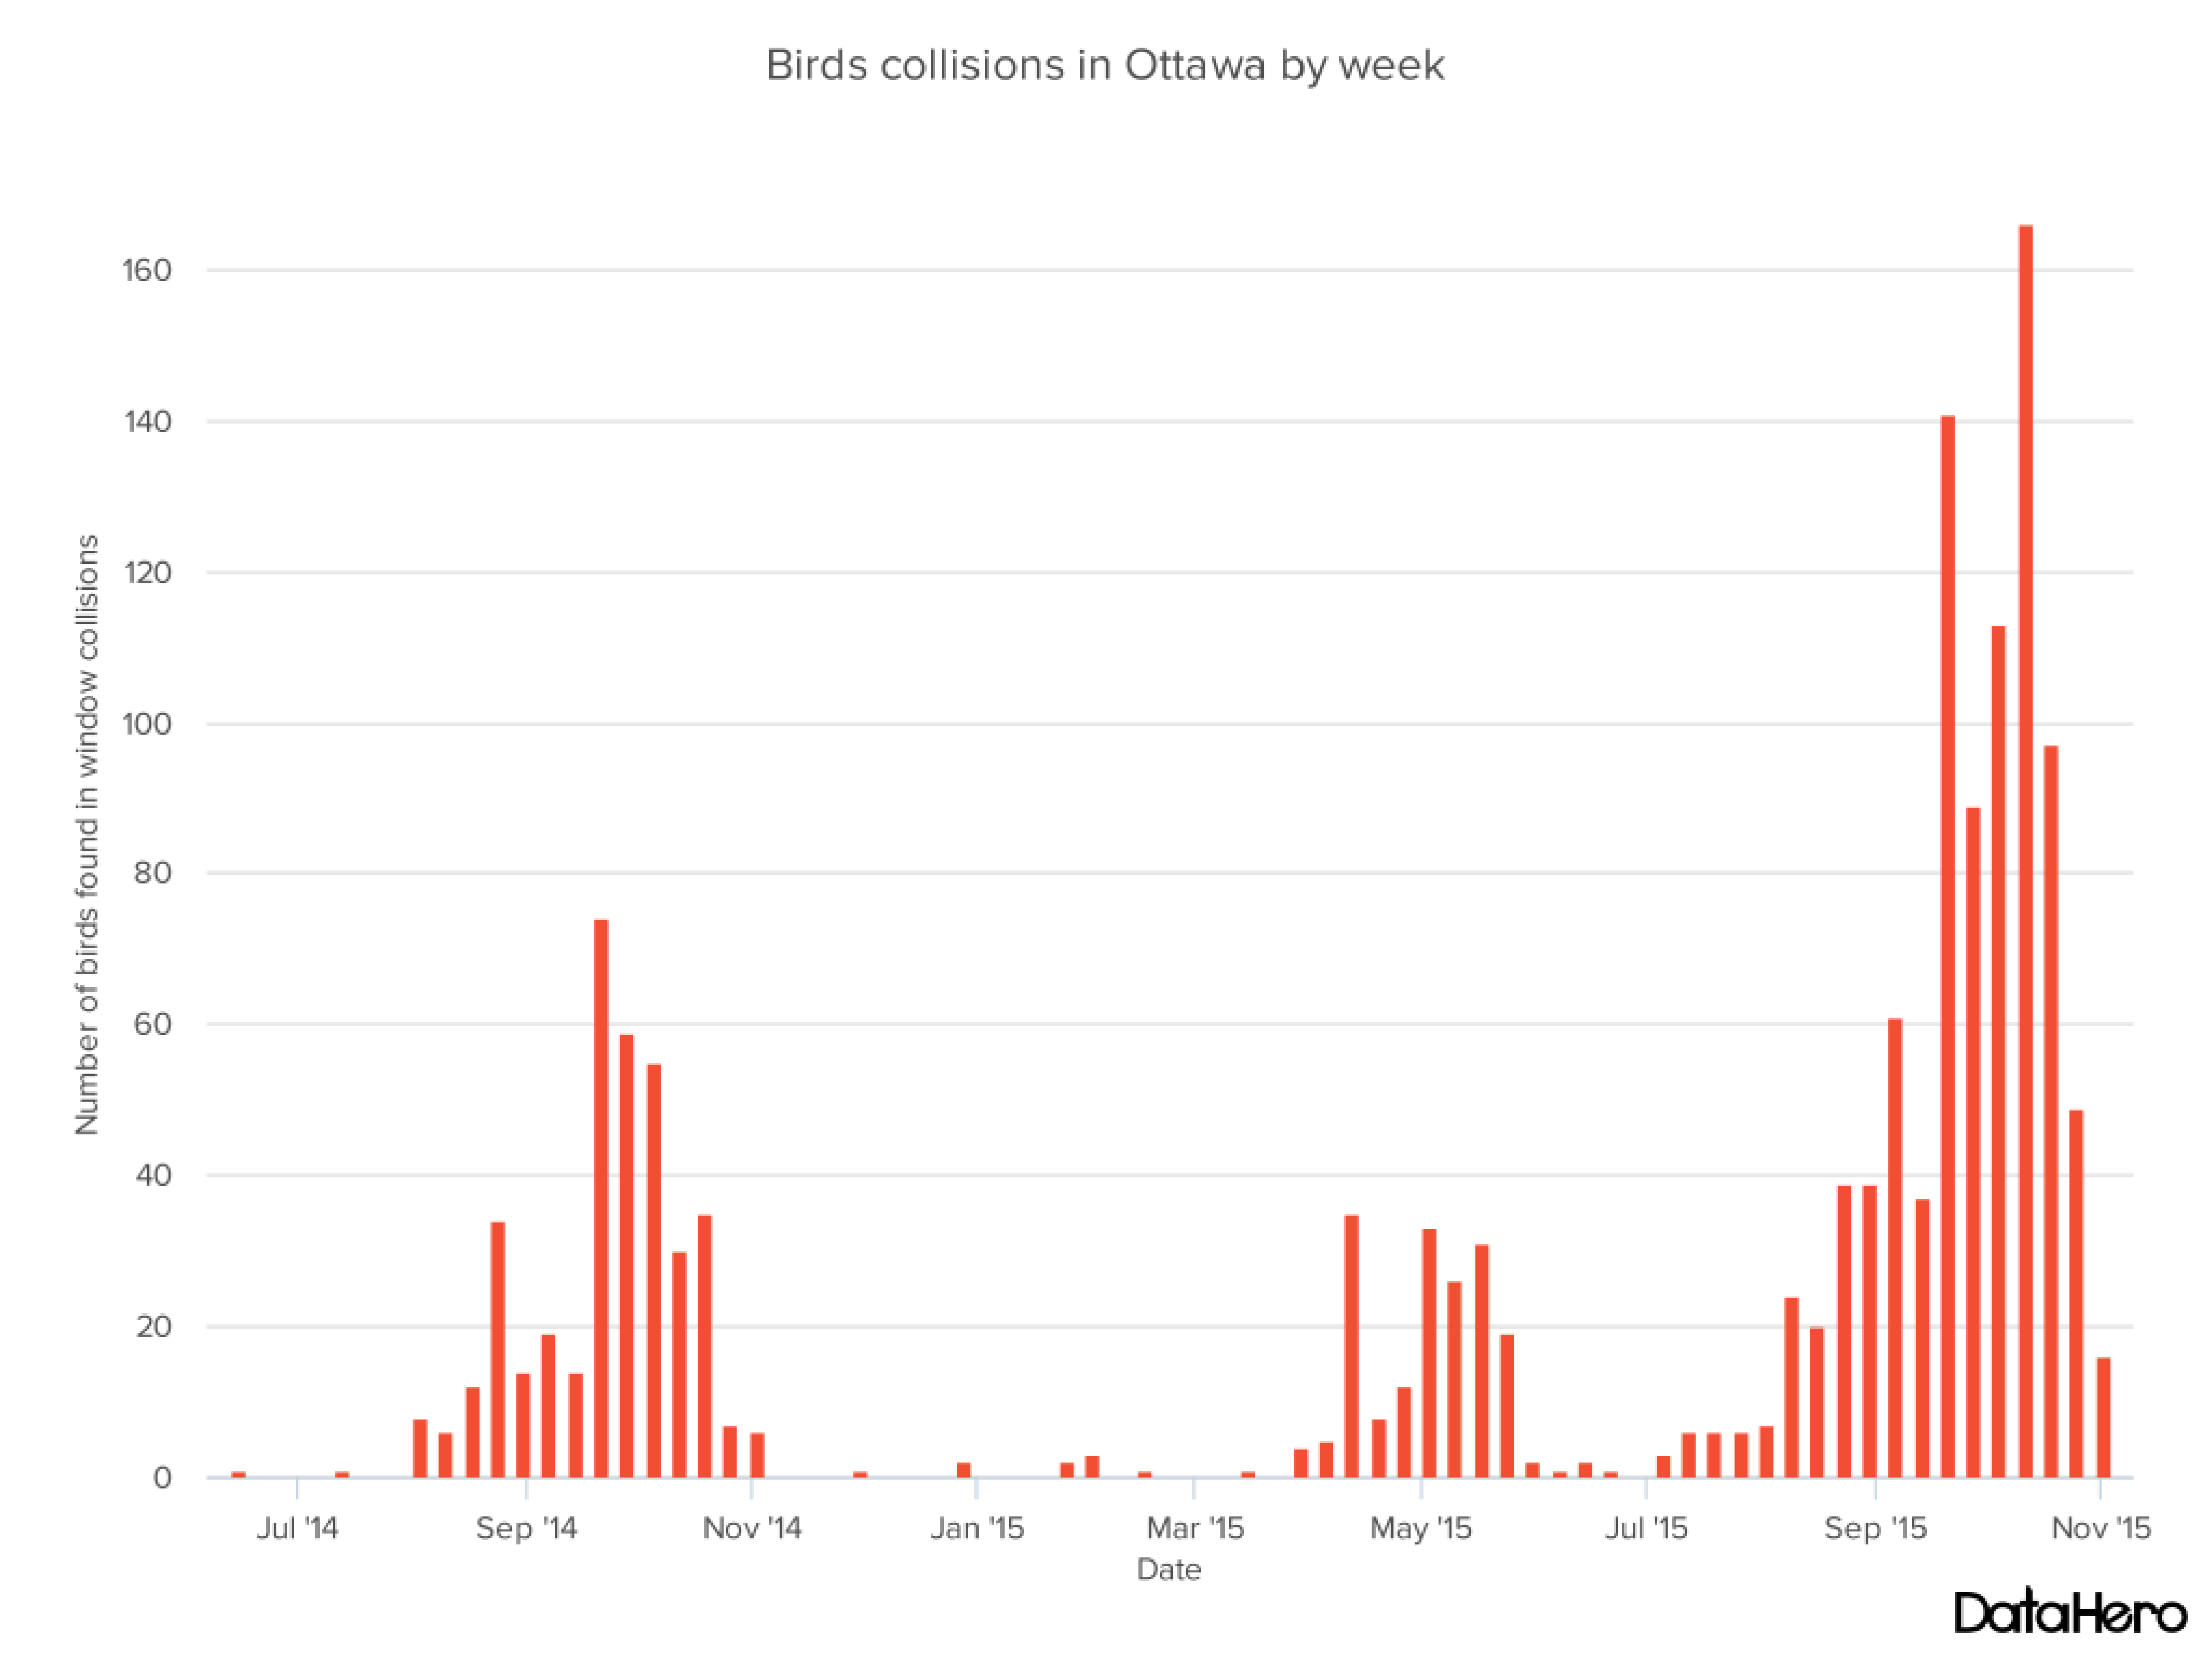
Source: Safe Wings Ottawa data, June 2014-Nov 2015.