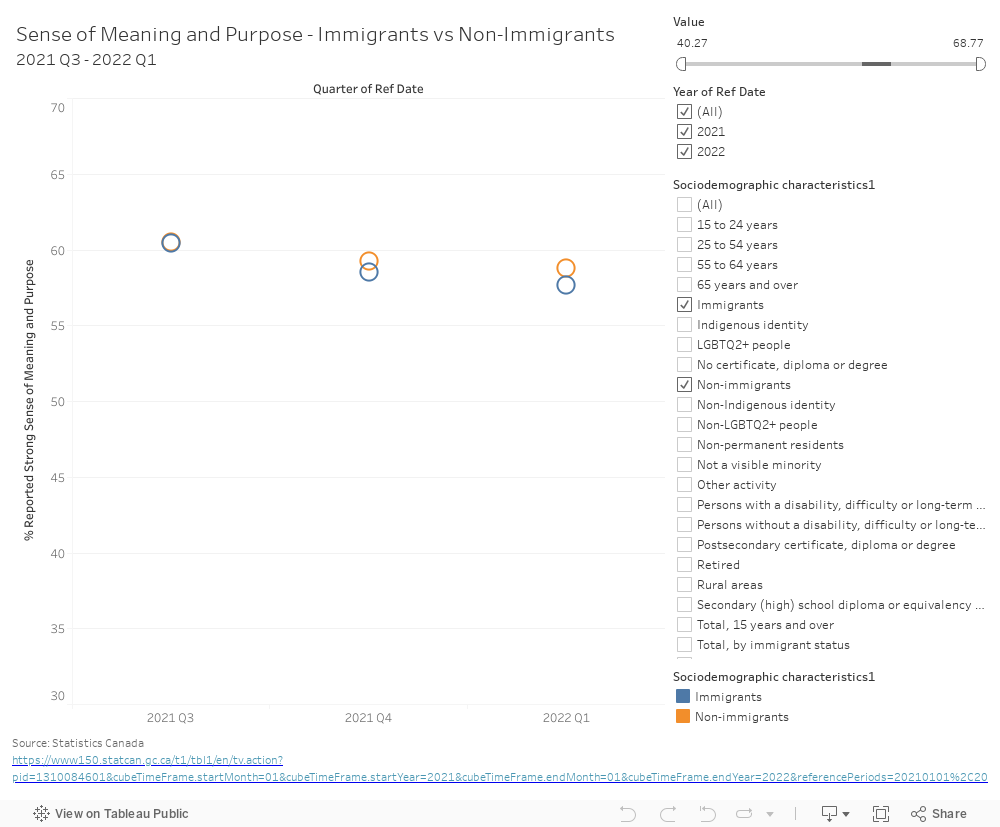
Over the last year, having a strong sense of meaning and purpose has dropped for immigrants at a quicker rate than non-immigrants.
The following graph represents the percentage of immigrants and non-immigrants that reported a strong sense of meaning and purpose in 2021 and 2022. Selecting different fields under “Sociodemographic characteristics” will display new data.
But these impacts are even worse for immigrant women. In the first quarter of 2022, immigrant men started to regain a strong sense of meaning and purpose while immigrant women have continued to drop since the second half of 2021.
This map is from the Statistics Canada 2016 Census, which measures the growth of married couples living without child the Halifax-area census tracts. The darker colours represent areas with the highest increase. The lighter areas, the lower increase. Click on each census track to see the result.
The number of married couples without any children in Cole Harbour district, has sharp increase compared with 2011, according to an analysis of the most recent census data released by Statistic Canada.
Cole Harbour district is located in southwest Dartmouth across the ferry from Halifax peninsula. In this area, the number of married couples who don’t have child increased 82 per cent from 2011 to 2016, which has the highest growth all over the Halifax Regional Municipality.
Áine Humble, a professor of Family Studies and Gerontology department, Mount Saint Vincent University, says that in general there is a long-term trend that people have fewer children in Canada.
The 37-year-old tea house owner, Philip Holmans, and his 31-year-old wife, Karen Holmans, have been living in Cole Harbour for 10 years after they got married. Instead of a child, they have a greyhound named Earl Grey.
Philip Holmans, left, and his wife, Karen Holmans, right, live in Cole Harbour for 10 years. Credit Photo: Philip Holmans’ Facebook.
This couple both have full-time jobs. Husband works for the tea house and wife works as a document administrator for medical records in a company.
Holmans regards his marriage as a partnership. He and his wife have their separate bank accounts and a communal account. “We avoid the financial argument that way,” says Philip.
“The real estate prices are good, compared with downtown Halifax”, says Holmans. He and his wife paid for their house right after they got married.
According to his personal research, the house price in Cole Harbour is around $250,000 dollars. But in downtown Halifax, a small condo should be paid $400,000 dollars plus condo fees on top of that.
Humble residents who who live in downtown Halifax are seniors and university students, and more young couples prefer living in Dartmouth, like Cole Harbour area.
“It is expensive to have children,” says Humble, “people maybe delay having children because they don’t have the finance to raise.”
In centre ofHalifax, the number of married couples living without child in three adjacent districts have 10.8 per cent decrease, 10.3 per cent decrease, and 2.4 per cent increase. If the harbour that divides Halifax and Dartmouth is the boundary, then the west side of the boundary where those three districts located, has the smallest increases, but the east side has the highest changes over Regional Municipality, according to the census data.
Besides the affordable house price, Holmans thinks it is convenient living in Cole Harbour community where the majority are middle-income families. “Just very ordinary people who live ordinary lives,” says Holmans, “and we like it”.
From 2011 to 2016, the number of couples living without children rose faster than the number of couples with children. The Daily says “Trends in the share of couples living with or without children also reflect the growing diversity of households and families in Canada.”
“Financial reasons could be related to the level of governmental support for the family,” says Humble.
Halifax’s population changed 4.7 per cent 2006 between 2011, down to 3.3 per cent compared to the period between 2011 and 2016.
In January 2016, Rev. Anthony Bailey and the Parkdale United Church community were preparing to celebrate the church’s 85th anniversary. A few days after advertising the annual Dr. Martin Luther King Jr. service, the community was shaken by an attack of hate-motivated graffiti.
“On the side of our church…scrawled in big red letters was ‘n–gers’, there was also another recognizable tag sign, on huge letters they had sprayed ‘Tupac’,” Bailey said.
“There was outrage and shock initially because this is an obvious attempt to intimidate our congregation and what we stand for.”
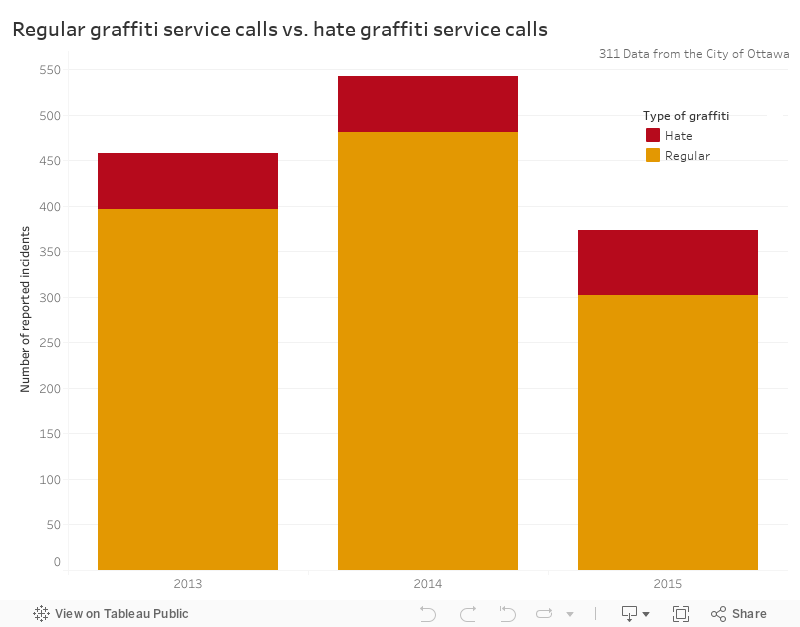
Graffiti is one of the most common forms of hate crimes in the city. In 2015, hate graffiti accounted for just over 60 percent of reported hate crimes in the city. According to Constable Stephane Quesnel with the Ottawa Police Service, “hate crimes in general could be threats or assaults, but are almost always graffiti.”
Hate graffiti can seriously affect a community or individual. “Whatever the intention was it doesn’t really matter, it’s the impact of using language like that, against people who have been victimized over the years, with such racial epithets.” Bailey has reached out with support for local Imams and Rabbis in Ottawa who have been victims of hate graffiti.
311 data from the City of Ottawa in 2015 shows that 1 in 5 calls regarding graffiti were reports of hate graffiti, that doubled from the previous year. However, that number may not be reflective of the actual number of hate graffiti incidents. Sometimes victims avoid reporting them out of fear.
“Not as reported as much by marginalized groups because they fear the backlash from publicity,” said Bailey.
“Every incident of racist graffiti is not reported in the media because of a fear of a copycat.”
Results from the 2009 General Social Survey on Victimization support this. Two-thirds of people who said they had been victims of hate-motivated incidents did not report them to police.
Quesnel offers other reasons why victims of hate graffiti might not be reporting it to police, “…because some people may not think that it is a hate crime and also because they don’t want to draw attention to themselves, if it was on a private residence for example,” he said. “Reasons for reporting are so that police are aware of it because it affects the whole community, and also, by doing so, we can hopefully catch the person doing it.”
Even if the hate graffiti incidents are reported they are often difficult to investigate. The OPS is currently investigating several reported incidents of swastikas appearing on OC Transpo buses. It can often be difficult to pinpoint when the hate graffiti first occurred and even harder to find the suspect(s). In the Parkdale United Church incident, the case remains open.
Hate graffiti is considered a serious offence under the Criminal Code of Canada and carries an increased penalty for assault or mischief motivated by bias, prejudice or hatred toward a particular group.
Although it’s rare to hear of someone being convicted of hate graffiti, a Calgary man was sentenced to eight months in jail and issued a $5,000 fine after he spray painted hateful graffiti targeted towards Syrian refugees on a light rail transit station.
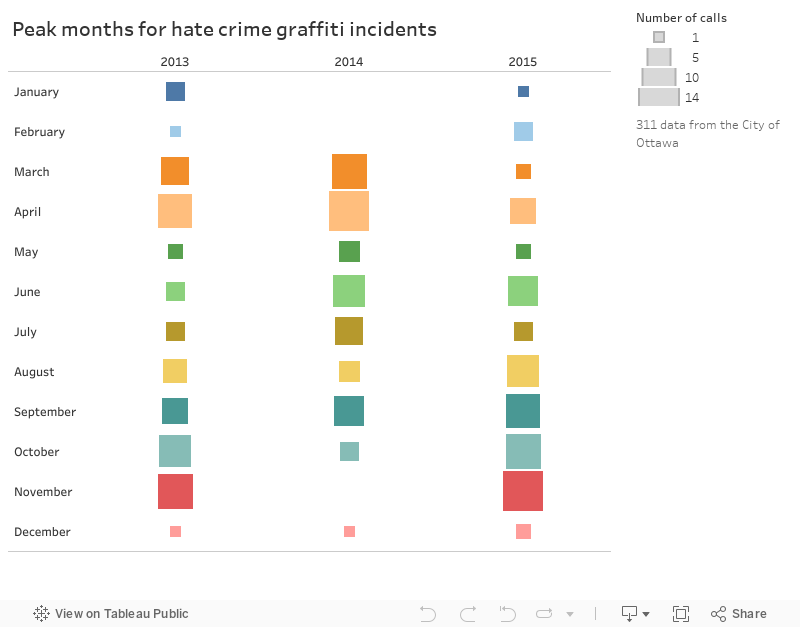
According to Quesnel the number of hate graffiti incidents often fluctuates. “It can go in spikes based on world events. For example, if there was a religious group that was a victim of an attack, the whole community becomes victimized, so there could be a local surge of hate graffiti towards them.”
Although the year isn’t over, 2016 is one of the lowest reported years for hate graffiti incidents in the City with only 26 reported incidents.
In the next 20 years the aboriginal population categorized by First Nations, Metis, and Inuit is projected to increase dramatically as more people begin to report themselves as being aboriginal.
According to data from the 2006 Census and 2011 National Household Survey (NHS) over the course of five years the aboriginal population as a whole increased by 20 per cent. While high fertility among aboriginal women is one factor in the population increase, the largest factor driving the growth has to do with an increased number of people identifying themselves as aboriginal.
Aboriginal identity has been a point of confusion at the legal, political, and personal level. Legislative changes to the Indian Act and most recently the Supreme Court recognition of Metis peoples in April, have sought to legally define aboriginal peoples. For the Metis population, recognition of their identity has been especially difficult in the face of discrimination.
“Metis identity is a very confusing thing to a lot of people, mainly because there’s two major aspects of our identity; not only do you have to be of mixed ancestry: European and aboriginal, but you also have to have that connection to a historical Metis settlement,” said Kelly Douquette, a Metis law student at the University of Ottawa.
Douquette thinks more people will identify themselves as Metis after the Supreme Court decision.
“Now that our rights are recognized and we are legitimized by the government, a lot of people don’t feel as afraid to come forward, and really be proud of who they are.”
“Self-reported identification is more important for the Metis population and the non-status Indian population, because even within the aboriginal population you have differences of main factors of growth,” Stephanie Langlois, senior analyst for Statistics Canada demography division, said.
“Someone in the past might not have identified themselves as an aboriginal person and five years later they self-identify with an aboriginal group.”
Annie Turner, a statistician with Statistics Canada, said the drastic increase can be attributed to a number of factors.
“We know that fertility rate is higher for aboriginal people compared to non-aboriginal people but there are many factors that we need to take into account when comparing the aboriginal population between 2006 to 2011, so there could be slight differences in the wording of the questions, differences in methodology between the 2006 Census and NHS, some legislative changes for example Bill C-31 in 1985 or Bill C-3 in 2011, which could affect these concepts of aboriginal identity or registered Indian status, as well as the definition of reserves.”
The 2036 projections estimate that the aboriginal populations could rise even higher if certain growth characteristics such as fertility and ethnic mobility continue their trends. In the western provinces such as Saskatchewan and Manitoba, aboriginal populations could make up one in five people in this provinces by 2036.
Meanwhile in the territories like the Yukon, Nunavut, and the North West Territories, Inuit hold the highest share of the total population although of a much smaller total population.
Compared to the non-aboriginal population, the aboriginal population is growing at a much faster rate. The non-aboriginal population is increasing less than one per cent a year, mainly due to immigration, while the aboriginal population is averaging 1.1 to 2.2 per cent.
One of Halifax’s most famous roads has become the dividing line between rich and poor.
Quinpool Road, the 2.5 km long stretch of pavement at the heart of the Halifax peninsula, has long been considered the traditional barrier between the working class North End and the more affluent South End.
But according to an analysis of data from Canada’s 2011 National Household Survey (NHS), the most recent data available, Quinpool Road now serves as the intersection between two economic groups.
By analyzing Halifax’s census tracts, geographic areas established by Statistics Canada, data shows the stark difference on either side of Quinpool Road. In the North, the average median household income is $53,372. In the South, the average median household income is $79,727.
Jennifer Watts, Councillor for Halifax Peninsula North, whose district takes up much of the northern peninsula, said she’s more interested in what might have changed in the last five years.
She points to the number of smaller businesses growing throughout her district as a reason for change.
Watts says while businesses may be creating job opportunities, and possibly raising the median income, she is afraid it may not be benefiting everyone.
“There can be new businesses and new jobs but they’re not necessarily employing or coming out of the historic groups living in the communities,” she says.
In the last five years she has noticed a trend where it has become harder for people to actually live on the Halifax peninsula.
Watts is afraid people who were represented in the 2011 survey have now been priced out of the area.
“There might in fact be a higher income [in the peninsula] now,” she says. “But if that’s true then we’re losing the diversity of people which represent various income levels.”
The NHS was a voluntary survey which means that some areas on the peninsula did not have enough data to be properly assessed by Statistics Canada. As a result, two tracts in the South End have a $0 value and have been removed from the analysis.
For now, the 2011 NHS indicates that there is a very clear divide.
Once mapped out, the data shows only one of the tracts in the North End has a median household income of more than $75,000. In the South End only two tracts are below that figure.
But for some, the unique nature of Quinpool has come to represent an opportunity.
“Any great city always has a main street that has an edge to it,” Laura Draeger, owner of Dilly Dally Coffee Cafe, says about Quinpool.
Laura Draeger, owner of Dilly Dally Coffee Cafe, serves as customer. (Alexander Quon)
In the seven weeks her shop has been open, business has exceeded what she planned for. She says her stores position on Quinpool is the reason why.
“We have everybody come through here,” Draeger says. “Soccer moms park here to quickly grab a coffee, students come through for a bite to eat and people come by pushing a cart with 4,000 bottles in it. But that’s the neighborhood.”
While the 2016 Census may change the divide found in the 2011 NHS, Watts is pessimistic.
“Maybe with the new census data coming out… it may look positive,” she said. “But is it really helping the people who have been marginalized in the community or is it just indicating new people have moved in?”
According to Statistics Canada, data from the 2016 Census is scheduled to be released throughout 2017